Les articles publiés sur le site
-
A Guide to App Analytics Tools that Drive Growth
7 mars, par Daniel Crough — App AnalyticsMobile apps are big business, generating £438 billion in global revenue between in-app purchases (38%) and ad revenue (60%). And with 96% of apps relying on in-app monetisation, the competition is fierce.
To succeed, app developers and marketers need strong app analytics tools to understand their customers’ experiences and the effectiveness of their development efforts.
This article discusses app analytics, how it works, the importance and benefits of mobile app analytics tools, key metrics to track, and explores five of the best app analytics tools on the market.
What are app analytics tools?
Mobile app analytics tools are software solutions that provide insights into how users interact with mobile applications. They track user behaviour, engagement and in-app events to reveal what’s working well and what needs improvement.
Insights gained from mobile app analytics help companies make more informed decisions about app development, marketing campaigns and monetisation strategies.
What do app analytics tools do?
App analytics tools embed a piece of code, called a software development kit (SDK), into an app. These SDKs provide the essential infrastructure for the following functions:
- Data collection: The SDK collects data within your app and records user actions and events, like screen views, button clicks, and in-app purchases.
- Data filtering: SDKs often include mechanisms to filter data, ensuring that only relevant information is collected.
- Data transmission: Once collected and filtered, the SDK securely transmits the data to an analytics server. The SDK provider can host this server (like Firebase or Amplitude), or you can host it on-premise.
- Data processing and analysis: Servers capture, process and analyse large stores of data and turn it into useful information.
- Visualisation and reporting: Dashboards, charts and graphs present processed data in a user-friendly format.

Six ways mobile app analytics tools fuel marketing success and drive product growth
Mobile app analytics tools are vital in driving product development, enhancing user experiences, and achieving business objectives.
#1. Improving user understanding
The better a business understands its customers, the more likely it is to succeed. For mobile apps, that means understanding how and why people use them.
Mobile analytics tools provide detailed insights into user behaviours and preferences regarding apps. This knowledge helps marketing teams create more targeted messaging, detailed customer journey maps and improve user experiences.
It also helps product teams understand the user experience and make improvements based on those insights.
For example, ecommerce companies might discover that users in a particular area are more likely to buy certain products. This allows the company to tailor its offers and promotions to target the audience segments most likely to convert.
#2 Optimising monetisation strategies for increased revenue and user retention
In-app purchases and advertising make up 38% and 60% of mobile app revenue worldwide, respectively. App analytics tools provide insights companies need to optimise app monetisation by:
- Analysing purchase patterns to identify popular products and understand pricing sensitivities.
- Tracking in-app behaviour to identify opportunities for enhancing user engagement.
App analytics can track key metrics like visit duration, user flow, and engagement patterns. These metrics provide critical information about user experiences and can help identify areas for improvement.
How meaningful are the impacts?
Duolingo, the popular language learning app, reported revenue growth of 45% and an increase in daily active users (DAU) of 65% in its Q4 2023 financial report. The company attributed this success to its in-house app analytics platform.

#3. Understanding user experiences
Mobile app analytics tools track the performance of user interactions within your app, such as:
- Screen views: Which screens users visit most frequently
- User flow: How users navigate through your app
- Session duration: How long users spend in your app
- Interaction events: Which buttons, features, and functions users engage with most
Knowing how users interact with your app can help refine your approach, optimise your efforts, and drive more conversions.
#4. Personalising user experiences
A recent McKinsey survey showed that 71% of users expect personalised app experiences. Product managers must stay on top of this since 76% of users get frustrated if they don’t receive the personalisation they expect.
Personalisation on mobile platforms requires data capture and analysis. Mobile analytics platforms can provide the data to personalise the user onboarding process, deliver targeted messages and recommend relevant content or offers.
Spotify is a prime example of personalisation done right. A recent case study by Pragmatic Institute attributed the company’s growth to over 500 million active daily users to its ability to capture, analyse and act on:
- Search behaviour
- Individual music preferences
- Playlist data
- Device usage
- Geographical location
The streaming service uses its mobile app analytics software to turn this data into personalised music recommendations for its users. Spotify also has an in-house analytics tool called Spotify Premium Analytics, which helps artists and creators better understand their audience.
#5. Enhancing app performance
App analytics tools can help identify performance issues that might be affecting user experience. By monitoring metrics like load time and app performance, developers can pinpoint areas that need improvement.
Performance optimisation is crucial for user retention. According to Google research, 53% of mobile site visits are abandoned if pages take longer than three seconds to load. While this statistic refers to websites, similar principles apply to apps—users expect fast, responsive experiences.
Analytics data can help developers prioritise performance improvements by showing which screens or features users interact with most frequently, allowing teams to focus their optimisation efforts where they’ll have the greatest impact.
#6. Identifying growth opportunities
App analytics tools can reveal untapped opportunities for growth by highlighting:
- Features users engage with most
- Underutilised app sections that might benefit from redesign
- Common user paths that could be optimised
- Moments where users tend to drop off
This intelligence helps product teams make data-informed decisions about future development priorities, feature enhancements, and potential new offerings.
For example, a streaming service might discover through analytics that users who create playlists have significantly higher retention rates. This insight could lead to development of enhanced playlist functionality to encourage more users to create them, ultimately boosting overall retention.
Key app metrics to track
Using mobile analytics tools, you can track dozens of key performance indicators (KPIs) that measure everything from customer engagement to app performance. This section focuses on the most important KPIs for app analytics, classified into three categories:
- App performance KPIs
- User engagement KPIs
- Business impact KPIs
While the exact metrics to track will vary based on your specific goals, these fundamental KPIs form the foundation of effective app analytics.

App performance KPIs
App performance metrics tell you whether an app is reliable and operating properly. They help product managers identify and address technical issues that may negatively impact user experiences.
Some key metrics to assess performance include:
- Screen load time: How quickly screens load within your app
- App stability: How often your app crashes or experiences errors
- Response time: How quickly your app responds to user interactions
- Network performance: How efficiently your app handles data transfers
User engagement KPIs
Engagement KPIs provide insights into how users interact with an app. These metrics help you understand user behaviour and make UX improvements.
Important engagement metrics include:
- Returning visitors: A measure of how often users return to an app
- Visit duration: How long users spend in your app per session
- User flow: Visualisation of the paths users take through your app, offering insights into navigation patterns
- Event tracking: Specific interactions users have with app elements
- Screen views: Which screens are viewed most frequently
Business impact KPIs
Business impact KPIs connect app analytics to business outcomes, helping demonstrate the app’s value to the organisation.
Key business impact metrics include:
- Conversion events: Completion of desired actions within your app
- Goal completions: Tracking when users complete specific objectives
- In-app purchases: Monitoring revenue from within the app
- Return on investment: Measuring the business value generated relative to development costs
Privacy and app analytics: A delicate balance
While app analytics tools can be a rich source of user data, they must be used responsibly. Tracking user in-app behaviour and collecting user data, especially without consent, can raise privacy concerns and erode user trust. It can also violate data privacy laws like the GDPR in Europe or the OCPA, FDBR and TDPSA in the US.
With that in mind, it’s wise to choose user-tracking tools that prioritise user privacy while still collecting enough data for reliable analysis.
Matomo is a privacy-focused web and app analytics solution that allows you to collect and analyse user data while respecting user privacy and following data protection rules like GDPR.
The five best app analytics tools to prove marketing value
In this section, we’ll review the five best app analytics tools based on their features, pricing and suitability for different use cases.
Matomo — Best for privacy-compliant app analytics
Matomo app analytics is a powerful, open-source platform that prioritises data privacy and compliance.

It offers a suite of features for tracking user engagement and conversions across websites, mobile apps and intranets.
Key features
- Complete data ownership: Full control over your analytics data with no third-party access
- User flow analysis: Track user journeys across different screens in your app
- Custom event tracking: Monitor specific user interactions with customisable events
- Ecommerce tracking: Measure purchases and product interactions
- Goal conversion monitoring: Track completion of important user actions
- Unified analytics: View web and app analytics in one platform for a complete digital picture
Benefits
- Eliminate compliance risks without sacrificing insights
- Get accurate data with no sampling or data manipulation
- Choose between self-hosting or cloud deployment
- Deploy one analytics solution across your digital properties (web and app) for a single source of truth
Pricing
Plan Price Cloud Starts at £19/month On-Premise Free Matomo is a smart choice for businesses that value data privacy and want complete control over their analytics data. It’s particularly well-suited for organisations in highly regulated industries, like banking.
While Matomo’s app analytics features focus on core analytics capabilities, its privacy-first approach offers unique advantages. For organisations already using Matomo for web analytics, extending to mobile creates a unified analytics ecosystem with consistent privacy standards across all digital touchpoints, giving organisations a complete picture of the customer journey.
Firebase — Best for Google services integration
Firebase is the mobile app version of Google Analytics. It’s the most popular app analytics tool on the market, with over 99% of Android apps and 77% of iOS apps using Firebase.
Firebase is popular because it works well with other Google services. It also has many features, like crash reporting, A/B testing and user segmentation.
Pricing
Plan Price Spark Free Blaze Pay-as-you-go based on usage Custom Bespoke pricing for high-volume enterprise users Adobe Analytics — Best for enterprise app analytics
Adobe Analytics is an enterprise-grade analytics solution that provides valuable insights into user behaviour and app performance.
It’s part of the Adobe Marketing Cloud and integrates easily with other Adobe products. Adobe Analytics is particularly well-suited for large organisations with complex analytics needs.
Pricing
Plan Price Select Pricing on quote Prime Pricing on quote Ultimate Pricing on quote While you must request a quote for pricing, Scandiweb puts Adobe Analytics at £2,000/mo–£2,500/mo for most companies, making it an expensive option.
Apple App Analytics — Best for iOS app analysis
Apple App Analytics is a free, built-in analytics tool for iOS app developers.
This analytics platform provides basic insights into user engagement, app performance and marketing campaigns. It has fewer features than other tools on this list, but it’s a good place for iOS developers who want to learn how their apps work.
Pricing
Apple Analytics is free.
Amplitude — Best for product analytics
Amplitude is a product analytics platform that helps businesses understand user behaviour and build better products.
It excels at tracking user journeys, identifying user segments and measuring the impact of product changes. Amplitude is a good choice for product managers and data analysts who want to make informed decisions about product development.
Pricing
Plan Price Starter Free Plus From £49/mo Growth Pricing on quote Choose Matomo’s app analytics to unlock growth
App analytics tools help marketers and product development teams understand user experiences, improve app performance and enhance products. Some of the best app analytics tools available for 2025 include Matomo, Firebase and Amplitude.
However, as you evaluate your options, consider taking a privacy-first approach to app data collection and analysis, especially if you’re in a highly regulated industry like banking or fintech. Matomo Analytics offers a powerful and ethical solution that allows you to gain valuable insights while respecting user privacy.
Ready to take control of your app analytics? Start your 21-day free trial.
-
Data Privacy Regulations : Essential Knowledge for Global Business
6 mars, par Daniel CroughIf you run a website that collects visitors’ data, you might be violating privacy regulations somewhere in the world. At last count, over 160 countries have privacy laws — and your customers in those countries know about them.
A recent survey found that 53% of people who answered know about privacy rules in their country and want to follow them. This is up from 46% two years ago. Furthermore, customers increasingly want to buy from businesses they can trust with their data.
That’s why businesses must take data privacy seriously. In this article, we’ll first examine data privacy rules, why we need them, and how they are enforced worldwide. Finally, we’ll explore strategies to ensure compliance and tools that can help.
What are data privacy regulations?
Let’s first consider data privacy. What is it? The short answer is individuals’ ability to control their personal information. That’s why we need laws and rules to let people decide how their data is collected, used, and shared. Crucially, the laws empower individuals to withdraw permission to use their data anytime.
The UNCTAD reports that only 13 countries had data protection laws or rules before the 2000s. Many existed before businesses could offer online services, so they needed updating. Today, 162 national laws protect data privacy, half of which emerged in the last decade.
Why is this regulation necessary?
There are many reasons, but the impetus comes from consumers who want their governments to protect their data from exploitation. They understand that participating in the digital economy means sharing personal information like email addresses and telephone numbers, but they want to minimise the risks of doing so.
Data privacy regulation is essential for:
- Protecting personal information from exploitation with transparent rules and guidelines on handling it securely.
- Implementing adequate security measures to prevent data breaches.
- Enforcing accountability for how data is collected, stored and processed.
- Giving consumers control over their data.
- Controlling the flow of data across international borders in a way that fully complies with the regulations.
- Penalising companies that violate privacy laws.
Isn’t it just needless red tape?
Data breaches in recent years have been one of the biggest instigators of the increase in data privacy regulations. A list of the top ten data breaches illustrates the point.
# Company Location Year # of Records Data Type 1 Yahoo Global 2013 3B user account information 2 Aadhaar India 2018 1.1B citizens’ ID/biometric data 2 Alibaba China 2019 1.1B users’ personal data 4 LinkedIn Global 2021 700M users’ personal data 5 Sina Weibo China 2020 538M users’ personal data 6 Facebook Global 2019 533M users’ personal data 7 Marriott Int’l Global 2018 500M customers’ personal data 8 Yahoo Global 2014 500M user account information 9 Adult Friend Finder Global 2016 412.2M user account information 10 MySpace USA 2013 360M user account information And that’s just the tip of the iceberg. Between November 2005 and November 2015, the US-based Identity Theft Resource Center counted 5,754 data breaches that exposed 856,548,312 records, mainly in that country.
It’s no wonder that citizens worldwide want organisations they share their personal data with to protect that data as if it were their own. More specifically, they want their governments to:
- Protect their consumer rights
- Prevent identity theft and other consumer fraud
- Build trust between consumers and businesses
- Improve cybersecurity measures
- Promote ethical business practices
- Uphold international standards
Organisations using personal data in their operations want to minimise financial and reputational risk. That’s common sense, especially when external attacks cause 68% of data breaches.
The terminology of data privacy
With 162 national laws already in place, the legal space surrounding data privacy grows more complex every day. Michalsons has a list of different privacy laws and regulations in force in significant markets around the world.
Fortunately, there’s plenty of commonality for two reasons: first, all countries want to solve the same problem; second, those drafting the legislation have adopted much of what other countries have already developed. As a result, the terminology remains almost the same, even when the language changes.
These are the core concepts at play:
Term Definition Access and control Consumers can access, review, edit and delete their data Data protection Organisations must protect data from being stolen or compromised Consumer consent Consumers can grant and withdraw or refuse access to their data Deletion Consumers can request to have their data erased Data breach When the security of data has been compromised Data governance The management of data within an organisation Double opt-in Two-factor authentication to add a layer of confirmation GDPR Governing data privacy in Europe since 2016 Personally identifiable information (PII) Data used to identify, locate, or contact an individual Pseudonymisation Replace personal identifiers with artificial identifiers or pseudonyms Publicly available information Data from official sources, without restrictions on access or use Rectification Consumers can request to have errors in their data corrected Overview of current data privacy legislation
Over three-quarters of the world has formulated and rolled out data privacy legislation — or is currently doing so. Here’s a breakdown of the laws and regulations you can expect to find in most significant markets worldwide.
Europe
Thoughts of protecting data privacy first occurred in Europe when the German government became concerned about automated data processing in 1970. A few years later, Sweden was the first country to enact a law requiring permits for processing personal data, establishing the first data protection authority.
General Data Protection Regulation (GDPR)
Sweden’s efforts triggered a succession of European laws and regulations that culminated in the European Union (EU) GDPR, enacted in 2016 and enforced from 25 May 2018. It’s a detailed and comprehensive privacy law that safeguards the personal data and privacy of EU citizens.
The main objectives of GDPR are:
- Strengthening the privacy rights of individuals by empowering them to control their data.
- Establishing a uniform data framework for data privacy across the EU.
- Improving transparency and accountability by mandating businesses to handle personal data responsibly and fully disclose how they use it.
- Extending the regulation’s reach to organisations external to the EU that collect, store and process the data of EU residents.
- Requiring organisations to conduct Protection Impact Assessments (PIAs) for “high-risk” projects.
ePrivacy Regulation on Privacy and Electronic Communications (PECR)
The second pillar of the EU’s strategy to regulate the personal data of its citizens is the ePrivacy Regulation on Privacy and Electronic Communications (EU PECR). Together with the GDPR, it will comprise data protection law in the union. This regulation applies to:
- Providers of messaging services like WhatsApp, Facebook and Skype
- Website owners
- Owners of apps that have electronic communication components
- Commercial direct marketers
- Political parties sending promotional messages electronically
- Telecommunications companies
- ISPs and WiFi connection providers
The EU PECR was intended to commence with GDPR on 25 May 2018. That didn’t happen, and as of January 2025, it was in the process of being redrafted.
EU Data Act
One class of data isn’t covered by GDPR or PECR: internet product-generated data. The EU Data Act provides the regulatory framework to govern this data, and it applies to manufacturers, suppliers, and users of IoT devices or related services.
The intention is to facilitate data sharing, use, and reuse and to facilitate organisations’ switching to a different cloud service provider. The EU Data Act entered into force on 11 January 2024 and is applicable from September 2025.
GDPR UK
Before Brexit, the EU GDPR was in force in the UK. After Brexit in 2020, the UK opted to retain the regulations as UK GDPR but asserted independence to keep the framework under review. It’s part of a wider package of reform to the data protection environment that includes the Data Protection Act 2018 and the UK PECR.
In the USA
The primary federal law regarding data privacy in the US is the Privacy Act of 1974, which has been in revision for some time. However, rather than wait for the outcome of that process, many business sectors and states have implemented their own measures.
Sector-specific data protection laws
This sectoral approach to data protection relies on a combination of legislation, regulation and self-regulation rather than governmental control. Since the mid-1990s, the country has allowed the private sector to lead on data protection, resulting in ad hoc legislation arising when circumstances require it. Examples include the Video Privacy Protection Act of 1988, the Cable Television Protection and Competition Act of 1992 and the Fair Credit Reporting Act.

California Consumer Privacy Act (CCPA)
California was the first state to act when federal privacy law development stalled. In 2018, it enacted the California Consumer Privacy Act (CCPA) to protect and enforce Californians’ rights regarding the privacy of their personal information. It came into force in 2020.
California Privacy Act (CPRA)
In November of that same year, California voters approved the California Privacy Rights Act (CPRA). Billed as the strongest consumer privacy law ever enacted in the US, CPRA works with CCPA and adds the best elements of laws and regulations in other jurisdictions (Europe, Japan, Israel, New Zealand, Canada, etc.) into California’s personal data protection regime.
Virginia Consumer Data Protection Act (CDPA)
In March 2021, Virginia became the next US state to implement privacy legislation. The Virginia Consumer Data Protection Act (VCDPA), which is also informed by global legislative developments, tries to strike a balance between consumer privacy protections and business interests. It governs how businesses collect, use, and share consumer data.
Colorado Privacy Act (CPA)
Developed around the same time as VCDPA, the Colorado Privacy Act (CPA) was informed by that law and GDPR and CCPA. Signed into law in July 2021, the CPA gives Colorado residents more control over their data and establishes guidelines for businesses on handling the data.
Other states generally
Soon after, additional states followed suit and, similar to Colorado, examined existing legislation to inform the development of their own data privacy laws and regulations. At the time of writing, the states with data privacy laws at various stages of development were Connecticut, Florida, Indiana, Iowa, Montana, New York, Oregon, Tennessee, Texas, and Utah.
By the time you read this article, more states may be doing it, and the efforts of some may have led to laws and regulations coming into force. If you’re already doing business or planning to do business in the US, you should do your own research on the home states of your customers.
Globally
Beyond Europe and the US, other countries are also implementing privacy regulations. Some were well ahead of the trend. For example, Chile’s Law on the Protection of Private Life was put on the books in 1999, while Mauritius enacted its first Data Protection Act in 2004 — a second one came along in 2017 to replace it.
Canada
The regulatory landscape around data privacy in Canada is as complicated as it is in the US. At a federal government level, there are two laws: The Privacy Act for public sector institutions and the Personal Information Protection and Electronic Documents Act (PIPEDA) for the private sector.
PIPEDA is the one to consider here. Like all other data privacy policies, it provides a framework for organisations handling consumers’ personal data in Canada. Although not quite up to GDPR standard, there are moves afoot to close that gap.
The Digital Charter Implementation Act, 2022 (aka Bill C-27) is proposed legislation introduced by federal agencies in June 2022. It’s intended to align Canada’s privacy framework with global standards, such as GDPR, and address emerging digital economy challenges. It may or may not have been finalised when you read this.
At the provincial level, three of Canada’s provinces—Alberta, British Columbia, and Quebec—have introduced laws and regulations of their own. Their rationale was similar to that of Bill C-27, so they may become redundant if and when that bill passes.
Japan
Until recently, Japan’s Act on the Protection of Personal Information (APPI) was considered by many to be the most comprehensive data protection law in Asia. Initially introduced in 2003, it was significantly amended in 2020 to align with global privacy standards, such as GDPR.
APPI sets out unambiguous rules for how businesses and organisations collect, use, and protect personal information. It also sets conditions for transferring the personal information of Japanese residents outside of Japan.

China
The new, at least for now, most comprehensive data privacy law in Asia is China’s Personal Information Protection Law (PIPL). It’s part of the country’s rapidly evolving data governance framework, alongside the Cybersecurity Law and the Data Security Law.
PIPL came into effect in November 2021 and was informed by GDPR and Japan’s APPI, among others. The data protection regime establishes a framework for protecting personal information and imposes significant compliance obligations on businesses operating in China or targeting consumers in that country.
Other countries
Many other nations have already brought in legislation and regulations or are in the process of developing them. As mentioned earlier, there are 162 of them at this point, and they include:
Argentina Costa Rica Paraguay Australia Ecuador Peru Bahrain Hong Kong Saudi Arabia Bermuda Israel Singapore Brazil Mauritius South Africa Chile Mexico UAE Colombia New Zealand Uruguay Observant readers might have noticed that only two countries in Africa are on that list. More than half of the 55 countries on the continent have or are working on data privacy legislation.
It’s a complex landscape
Building a globalised business model has become very complicated, with so much legislation already in play and more coming. What you must do depends on the countries you plan to operate in or target. And that’s before you consider the agreements groups of countries have entered into to ease the flow of personal data between them.
In this regard, the EU-US relationship is instructive. When GDPR came into force in 2016, so did the EU-US Privacy Shield. However, about four years later, the Court of Justice of the European Union (CJEU) invalidated it. The court ruled that the Privacy Shield didn’t adequately protect personal data transferred from the EU to the US.
The ruling was based on US laws that allow excessive government surveillance of personal data transferred to the US. The CJEU found that this conflicted with the basic rights of EU citizens under the European Union’s Charter of Fundamental Rights.
A replacement was negotiated in a new mechanism: the EU-US Data Privacy Framework. However, legal challenges are expected, and its long-term viability is uncertain. The APEC Privacy Framework and the OECD Privacy Framework, both involving the US, also exist.

Penalties for non-compliance
Whichever way you look at it, consumer data privacy laws and regulations make sense. But what’s really interesting is that many of them have real teeth to punish offenders. GDPR is a great example. It was largely an EU concern until January 2022 when the French data protection regulator hit Google and Facebook with serious fines and criminal penalties.
Google was fined €150M, and Facebook was told to pay €60M for failing to allow French users to reject cookie tracking technology easily. That started a tsunami of ever-larger fines.
The largest so far was the €1.2B fine levied by the Irish Data Protection Commission on Meta, the owner of Instagram, Facebook, and WhatsApp. It was issued for transferring European users’ personal data to the US without adequate data protection mechanisms. This significant penalty demonstrated the serious financial implications of non-compliance.
These penalties follow a structured approach rather than arbitrary determinations. The GDPR defines an unambiguous framework for fines. They can be up to 4% of a company’s total global turnover in the previous fiscal year. That’s a serious business threat.
What should you do?
For businesses committed to long-term success, accepting and adapting to regulatory requirements is essential. Data privacy regulations and protection impact assessments are here to stay, with many national governments implementing similar frameworks.
However, there is some good news. As you’ve seen, many of these laws and regulations were informed by GDPR or retrospectively aligned. That’s a good place to start. Choose tools to handle your customer’s data that are natively GDPR-compliant.
For example, web analytics is all about data, and a lot of that data is personal. And if, like many people, you use Google Analytics 4, you’re already in trouble because it’s not GDPR-compliant by default. And achieving compliance requires significant additional configuration.
A better option would be to choose a web analytics platform that is compliant with GDPR right off the bat. Something like Matomo would do the trick. Then, complying with any of the tweaks individual countries have made to the basic GDPR framework will be a lot easier—and may even be handled for you.
Privacy-centric data strategies
Effective website data analysis is essential for business success. It enables organisations to understand customer needs and improve service delivery.
But that data doesn’t necessarily need to be tied to their identity — and that’s at the root of many of these regulations.
It’s not to stop companies from collecting data but to encourage and enforce responsible and ethical handling of that data. Without an official privacy policy or ethical data collection practices, the temptation for some to use and abuse that data for financial gain seems too great to resist.
Cookie usage and compliance
There was a time when cookies were the only way to collect reliable information about your customers and prospects. But under GDPR, and in many countries that based or aligned their laws with GDPR, businesses have to give users an easy way to opt out of all tracking, particularly tracking cookies.
So, how do you collect the information you need without cookies? Easy. You use a web analytics platform that doesn’t depend wholly on cookies. For example, in certain countries and when configured for maximum privacy, Matomo allows for cookieless operation. It can also help you manage the cookie consent requirements of various data privacy regulations.
Choose the right tools
Data privacy regulations have become a permanent feature of the global business landscape. As digital commerce continues to expand, these regulatory frameworks will only become more established. Fortunately, there is a practical approach forward.
As mentioned several times, GDPR is considered by many countries to be a particularly good example of effective data privacy regulation. For that reason, many of them model their own legislation on the EU’s effort, making a few tweaks here and there to satisfy local requirements or anomalies.
As a result, if you comply with GDPR, the chances are that you’ll also comply with many of the other data privacy regulations discussed here. That also means that you can select tools for your data harvesting and analytics that comply with the GDPR out of the box, so to speak. Tools like Matomo.
Matomo lets website visitors retain full control over their data.
Before deciding whether to go with Matomo On-premise or the EU-hosted cloud version, why not start your 21-day free trial? No credit card required.
-
How to Check Website Traffic : A Complete Guide
If you want to learn about the health of your website and the success of your digital marketing initiatives, there are few better ways than checking your website traffic.
Checking website traffic is a great way to get a dopamine hit when things are up. And it’s a great way to troubleshoot problems when things go down. It’s also a critical data source for marketing and web teams. But to get the most out of it, you need reliable data sources, the ability to track them over time and a way to monitor the competition.
This article explains how to check website traffic (for your site and your competitors), explores nine tools that can help and discusses why some methods are better than others.
Why check website traffic?
Dopamine hits aside, monitoring website traffic is crucial to a business — even for a primarily brick-and-mortar operation. In this internet age, customers and prospects are far more likely to research a company online before buying anything.
SOCi’s 2024 Consumer Behavior Index found that 8 in 10 US consumers use the internet to search for local businesses at least once a week. And Statista found that 55% of UK shoppers always do some online research before making a major purchase.
And trend lines suggest these numbers are likely to continue climbing. Businesses need to know what’s happening on their sites, and that’s difficult to achieve without traffic data.
Indeed, website data allows companies to better understand their target audiences, measure the effectiveness of marketing efforts and channels, and identify areas of the website that need work.
Let’s dig into those ideas in a little more detail.

Benchmark site performance
Keeping regular tabs on traffic levels is a great way to track a website’s performance over time. It can help with planning for the future and identifying current problems.
For instance, rising traffic levels may mean expanding the business’s offering or investing in more inventory. On the flip side, decreasing traffic levels may suggest it’s time to revamp marketing strategies or look into issues impacting SEO.
Analyse user behaviour
Checking website traffic, user behaviour, and other metrics shows marketing managers how users interact with the website. These traffic stats can help answer questions like:
- Which pages are users visiting?
- Which CTAs are they clicking on?
- Which page elements encourage users to take the desired actions?
It can also identify issues contributing to high bounce rates or declines in search rankings.
The better user behaviour is understood, the easier it is to give visitors what they want. For example, the data could reveal that users spend more time on landing pages than blogs. These valuable insights can be used to optimise blog content and improve performance.
Improve the user experience
Once user behaviour is well understood, it’s easier to make adjustments, update content and improve the overall user experience. This also allows companies to create more personalised customer experiences, which can lead to growth. Research shows companies that get personalisation right generate 40% more revenue from those activities than average players.
That could take the form of sweeping changes like rearranging a website’s navigation bar based on user behaviour. It could also be personalisation that uses analytics to transform sections or entire pages based on individual user behaviour.
Optimise digital marketing strategies
Knowing current traffic levels and how they trend over time helps teams set benchmarks and prioritise marketing efforts.
Monthly traffic reports can inform SEO efforts and benefit marketing attribution. For example, they could indicate when the time is right to double down on organic traffic or when the better strategy would be to invest more in PPC advertising.
Increasing organic traffic levels from other countries can help businesses identify new marketing opportunities. If traffic levels from a neighbouring country or a growing market increase significantly, it could be time for a cross-border campaign.
Filter unwanted traffic
A significant chunk of every website’s traffic comes from bots and other unwanted sources. This can compromise the quality of website data and make it harder to draw useful insights. While it’s nearly impossible to get rid of this traffic completely, many analytics tools have features to filter it out of the stats.
Why check competitors’ website traffic
Websites are windows into businesses and their strategies. That’s why monitoring traffic and other metrics drawn from competitors is essential.
There’s a lot to learn from the competition, both good and bad. What competitors do well can be replicated, and learning from the elements they get wrong can help you avoid making the same mistakes.
- Strategic planning: Looking at traffic on specific pages can offer insight into potential marketing campaigns and highlight gaps in the market that may be worth attacking. Looking at their organic, paid, social and referral traffic levels can highlight opportunities for growth or pinpoint the reasons for success in a particular area.
- Benchmarking: Looking at website traffic in isolation can lack context. Monitoring other sites’ engagement metrics, like bounce rate and average session duration, can give you an inside look at the competition, which can help you set realistic performance goals and benchmarks.
- Product Development: Significant traffic volume on certain pages can indicate shifts in demand and market trends, which may inform the development of new products or services. For example, if a competitive dog food supplier ranks well for the term “organic dog food”, that might be something to consider when formulating new products.
- Audience demographics: Comparing audience demographics between competitors can highlight opportunities and help a business narrow down its target audience. This guides messaging and campaign strategies to capture specific audience segments.
- Keyword opportunities: Examining the keywords driving the most traffic to a competitor’s website can help you uncover untapped SEO potential for your website. Analysing top-performing content on competing sites can help identify content improvement strategies to pull traffic away from competitors.
- Partnerships: Referrals are an often overlooked traffic metric. High volumes of such traffic indicate successful partnerships between competitors and third parties, which is a model worth emulating.
7 key website traffic metrics to track
Traffic metrics are not a case of one-size-fits-all. Those that are important today may not be tomorrow. It all depends on the priorities and goals at any one moment. That said, there are a few traffic metrics that always matter to some degree.
- New visitors: These are users who have never visited the website before. They are a great sign that marketing efforts are working and the website is reaching more people. But it’s also important to track how they behave on the website to ensure the site caters effectively to the needs of new visitors.
- Returning visitors: Returning visitors are coming back to the website for a reason: either they like the content they find or want to buy something. Either way, it’s excellent news. The more returning visitors, the better.
- Bounce rate: This measures how many users leave the website without taking action. Different analytics tools measure this metric differently.
- Session duration: This is the time users spend on the website, which can reveal whether they find the site engaging. And when considered alongside the next metric, it can be especially insightful.
- Pages per session: This measures the average number of pages users visit on a website. The more pages they visit and the longer users spend on the website, the more engaging it is.
- Traffic source: Traffic can come from various sources (organic, direct, social media, referral, etc.). Knowing the highest sources of referral traffic can help analyse and prioritise marketing efforts.
- User demographics: This shows who visits a website, what device they use, what country they come from, etc. While most website traffic will come from the countries targeted by marketing, an influx of new users from other countries can open the door to new opportunities.
9 tools to check website traffic
There are thousands of different web analytics tools that can provide decent website traffic analysis and functionality checks. They all use a similar combination of sophisticated algorithms, data collection techniques, statistical analysis and machine learning to deliver insights into visitor behaviour and site performance.
Most web analytics tools work by embedding bits of JavaScript or other tracking codes into a website. When users land on a website, it gathers data such as page views, session duration, and specific interactions. Many also use cookies to identify returning visitors, which lets them monitor user behaviour over time.
Many tools offer advanced event-tracking functionality. This captures specific actions, like clicks or form submissions, and provides a more granular view of engagement. The data is then statistically analysed to spot trends and calculate key metrics like bounce rates and conversion rates.
Some web analytics tools use machine learning to predict future user behaviour based on historical patterns. Others aggregate data to provide insights via charts comparing website performance with selected competitors’ websites.
This section explores nine popular tools for checking website traffic and highlights their unique features and benefits.
1. Checking website traffic with Google Analytics
Google Analytics is usually the first place to start for anyone looking to check their website traffic. It’s free to use, incredibly popular and offers a wide range of traffic reports.
It breaks down historical traffic data in many different ways. It can split traffic by acquisition channel (organic, social media, direct, etc.), by country, device or demographic. It also provides real-time traffic reports that offer a snapshot of users on the site right now and over the last 30 minutes.

GA4’s Traffic acquisition report helps to understand where website and app visitors are coming from. Image source Google Analytics may be one of the most popular ways to check website traffic, but it could be better. Google Analytics 4 (GA4) is difficult to use compared to its predecessor, and it also imposes data tracking limits in accordance with privacy laws. If users refuse cookie consent, Google Analytics won’t record those visits. In other words, using Google Analytics alone doesn’t provide a complete view of the traffic.

GA4 can also help to pinpoint the pages and screens that receive the most traffic. Image source Also, GA4 relies on sampling when processing large datasets or complex queries. When the volume of data exceeds certain thresholds, it only considers a subset of the data to generate reports instead of processing every single data point.
There are pros and cons to this approach. While it speeds up analysis and reduces the load on the system, it can also lead to inaccuracies in insights delivered. When analysing traffic patterns over a busy period, GA4 may only use a portion of the data to calculate and then extrapolate metrics.
As a result, trends or anomalies might be overlooked or misconstrued, which could mean missed opportunities or poor decisions. That’s why it’s important to use Google Analytics alongside other web analytics tools (like Matomo) that don’t suffer from the same privacy issues. That way, it’s possible to track every single user who visits the website.
2. Checking website traffic with Google Search Console
Google Search Console is a free tool that analyses a website’s Google search traffic. The top-line report shows how many times the website has appeared in Google Search, how many clicks it has received, the average clickthrough rate and its average position in the search results.

Google Search Console can reveal keyword patterns and spikes in interest Image source It’s a great way to understand what the website ranks for and how much traffic organic rankings generate. It will also show which pages are indexed in Google and whether there are any crawling errors.
Unfortunately, Google Search Console is limited if a complete view of traffic is needed. While the search traffic can be analysed in great detail, it will not report how users who access the website behave on it.
3. Checking website traffic with Similarweb
Similarweb is a website analysis tool that estimates the total traffic of any site on the internet. It is one of the best traffic checker tools for estimating how much web traffic competitors receive.
What’s great about Similarweb is that it estimates total traffic, not just traffic from search engines like many SEO tools. It even breaks down traffic by different channels for easy comparison.

Similarweb’s dashboard reveals how traffic levels increase or decrease month-over-month. Image source Similarweb provides an estimate of total visits, bounce rate, the average number of pages users view per visit and the average duration on the site. The company also has a free browser extension that continues checking website traffic estimates while the user is browsing the web.
Similarweb is free to use, up to a point. However, to get the most out of this tool, you must upgrade to the premium plan, which starts at $125 per user per month.
The price isn’t Similarweb’s only downside. Ultimately, it provides reasonably accurate estimates but is no match for a comprehensive traffic analytics tool.
4. Checking website traffic with Semrush
Semrush is a collection of marketing solutions for online businesses. Its Traffic Analytics tool checks the website traffic of up to 100 sites and compares that data side-by-side. For each site, it reveals the top pages, the regions from which most of the traffic comes, and the locations from which the most referrals come.
Semrush also gathers insights into competitors’ audiences and their activity, especially activity that overlaps between the sites being checked. It extracts and analyses comprehensive data on organic and paid search, social media, and backlinks.

Semrush’s traffic analytics monitors traffic stats for competitor websites. Image source However, there are notable downsides. Semrush can be pricey, with plans starting at about $119.95 per month or $1,199.40 annually. This cost may be prohibitive for smaller businesses or freelancers. Still, a free version offers most of the functionality but with a limited number of daily reports.
5. Checking website traffic with Ahrefs
Ahrefs‘s biggest strength is its organic traffic estimation capabilities. It estimates monthly visits from Google worldwide, Google keywords in the top 100 that a website ranks for, and traffic value via equivalence to PPC.

Ahrefs’ SEO dashboard uses trend graphs to show how projects are performing. Image source Ahrefs bases its estimates on ranking data from a database of 12 billion keywords, which is why it is so powerful. It generates a detailed report that includes organic traffic estimates, backlink data, and top-performing keywords.
However, the numbers produced by Ahrefs are estimates based on the available data and won’t always be 100% accurate. This is particularly true for smaller or newer websites that lack the data volumes needed for accuracy.
It’s a great SEO marketing tool that’s free to use within certain limits, but there is some value in registering for a paid plan. There are several options, beginning with the $129 per month Lite plan and extending to the Enterprise Plan for $1,499 monthly.
6. Checking website traffic with Serpstat
Serpstat is an SEO solution that grew from a simple keyword research tool. It offers more comprehensive features to help businesses understand their website’s performance. It helps improve a site’s visibility through tools for rank tracking, keyword research, traffic checking, backlink analysis, and site auditing.

Serpstat’s Domain Analytics dashboard shows trends over a 12-month period. Image source It provides metrics like estimated monthly visits, traffic sources (organic, paid, and referral), and insights into top-performing pages. Serpstat also offers competitor analysis features that help to identify market trends and refine growth strategies. However, like Ahrefs, the numbers provided are estimates, which are only as good as the depth of data from which they are derived.
The free version is fine for basic analysis, but signing up for one of the paid plans is advisable for commercial use. Pricing ranges from $59 per month to a monthly fee of $479 for the Agency plan. There is an option to pay annually at a discount.
7. Checking website traffic with SEO PowerSuite
SEO PowerSuite also goes some distance beyond just website traffic checking. As the name implies, it’s a suite of tools to improve website rankings.

Rank Tracker’s SEO dashboard reveals organic session growth over time. Image source. There are four tools in the suite:
- Rank Tracker enables tracking a website’s search engine rankings across multiple keywords and search engines.
- WebSite Auditor offers SEO analysis of website pages and recommends actions to boost performance.
- SEO SpyGlass analyses a website’s backlink profile to highlight link-building possibilities that’d help improve performance.
- LinkAssistant helps identify websites suitable for link-building and recommends viable outreach opportunities.
SEO PowerSuite has a free plan and two premium plans with varying functionality. The monthly cost could be as much as $139.67, depending on the features needed. Annual pricing options are also available.
8. Checking website traffic with Ubersuggest
Ubersuggest is also an SEO-focused tool. It offers website traffic analysis, keyword rankings, backlink profiles, and competitor insights. These are packaged in reports that provide an overview of website traffic, including monthly organic traffic totals and the number of organic keywords the site ranks for. Ubersuggest also offers content suggestions.

Ubersuggest’s Domain Overview Dashboard provides an overview of a website’s traffic. Image source Like other tools in this category, Ubersuggest doesn’t collect comprehensive data, so its numbers are estimates. This means the accuracy can vary. However, it remains a solid choice for providing great insights and enhancing a website’s online presence.
Like many tools in this category, there is a free version to give potential customers a taste, which is restricted by volume more than features. The paid plans range from around $29 per month for one website on the individual plan to about $99 per month for 8-15 websites on the Enterprise plan. Discounted annual pricing is also an option.
9. Checking website traffic with MonsterInsights
MonsterInsights is a tool worth considering for websites built on WordPress because it’s not a website checking tool in the usual sense. It’s a WordPress plugin that simplifies the task by integrating Google Analytics directly into a website.
MonsterInsights then uses the raw data provided by GA4 to extract actionable insights based on audience preferences and activity. This makes it easier to focus on the relevant metrics for different types of websites. For example, the metrics used to measure a blog site would not be the same as those for an ecommerce site.
But there are some downsides, too. While the basic version is free, it has limited features, and the most potent functionality requires a premium subscription. Those start at $249 per year for a single site, or the Pro plan at $499 for up to five sites. Agencies looking to work with up to 25 sites are in for $999.

MonsterInsights’ Analytics Overview offers a snapshot of a website’s traffic volumes. Image source There’s another option
Although many of these tools have free versions, those tend to be heavily restricted, and premium plans can be expensive. A website has to generate serious revenue to deliver a decent return on investment (ROI) to justify the costs.
As more countries adopt GDPR-like privacy regulations, brands must ensure they’re using compliant, privacy-centric analytics tools.
Matomo Analytics is one such tool. It’s an ethical, open-source solution that helps you collect accurate data about your website’s traffic and make more informed decisions. This enhances the customer experience and ensures GDPR compliance and user privacy.
It’s completely free to install as an on-premise solution. Alternatively, there’s the subscription-based Matomo Cloud version.
How to check website traffic on Matomo
Apart from a better ROI picture, Matomo offers a more reliable assessment of your website’s traffic than Google Analytics 4. It also provides multiple ways to check organic search traffic:
- Visits log report
- Real-time visitor map
- Visits in real-time report
Let’s look at all of them one by one.
The visits log report is a unique rundown of your site’s visitors. It offers a much more granular view than other traffic checker tools, which only show the total number of visitors for a given period.

Matomo’s Visits Log Report provides a detailed breakdown of all website visitors. You can access the visits log report by clicking on the reporting menu and then clicking Visitor and Visits Log. From there, you’ll be able to scroll through every user session and see the following information:
- The location of the user
- The total number of actions they took
- The length of time on site
- How they arrived at your site
- The device they used to access your site
It may be overwhelming if your site receives thousands of visitors at a time. But it’s a great way to understand users at an individual level and appreciate the lifetime activity of specific users.
The Real-time visitor map shows site visitors’ location for a given timeframe. If you have an international website, it’s a fantastic way to see exactly where your traffic comes from.

Matomo’s Geo-Location dashboard reveals where website visitors are located. Image source You can access the Real-time Visitor Map by clicking Visitor in the main navigation menu and then Real-time Map. The map itself is colour-coded. Larger orange bubbles represent recent visits, and smaller dark orange and grey bubbles represent older visits. The map will refresh every five seconds, and new users appear with a flashing effect.
If you run TV or radio adverts, Matomo’s Real-time Map provides an immediate read on the effectiveness of your campaign. If your map lights up in the minutes following your ad, you know it’s been effective. It can also help you identify the source of bot attacks, too.
Finally, the Visits in Real-time report provides a snapshot of who is browsing your website. You can access this report under Visitors > Real-time and add it to your custom dashboards as a widget.
Open the report, and you’ll see the real-time flow of your site’s users and counters for visits and pageviews over the last 30 minutes and 24 hours. The report refreshes every five seconds with new users added to the top of the report with a fade-in effect.

Matomo’s Visits in Real-time report displays new visits or current visitors viewing a new page. Image source The report provides a snapshot of each visitor, including:
- Whether they are new or returning
- Their country
- Their browser
- Their operating system
- The number of actions they took
- The time they spent on the site
- The channel they came in from
- Whether the visitor converted a goal
Why do my traffic reports differ?
If you use more than one of the methods above to check your website traffic, you’ll quickly realise that every traffic report differs. In some cases, the reasons are obvious. Any tool that estimates your traffic without adding code to your website is just that: an estimate. Tools like many of those mentioned here will never offer the accuracy of analytics platforms like Matomo and Google Analytics.
But what about the differences between these analytics platforms themselves? While each platform records user behaviour differently, significant differences in website traffic reports between analytics platforms are usually due to how each platform handles user privacy.
A platform like Google Analytics requires users to accept a cookie consent banner to track them. If they accept, great. Google collects all of the data that any other analytics platform does. It may even collect more. However, if users reject cookie consent banners, Google Analytics can’t track them. They simply won’t show up in your traffic reports.
That doesn’t happen with all analytics platforms, however. A privacy-focused alternative like Matomo doesn’t require cookie consent banners (apart from in the United Kingdom and Germany). Therefore, it can continue to track visitors even after they have rejected a cookie consent screen from Google Analytics. This means virtually all website traffic will be tracked regardless of whether users accept a cookie consent banner. And it’s why traffic reports in Matomo are often much higher than in Google Analytics.

Many adults in the EU refuse to allow tracking for advertising purposes, and most reject cookies when they can. This means different analytics tools can offer vastly different traffic stats. Around half (47.32%) of adults in the European Union refuse to allow personal data tracking for advertising purposes, and 95% of people will reject additional cookies when it is easy to do so. So relying on cookies limits your results — and causes you to miss out on valuable user data.
If you’re serious about using web analytics to improve your website and optimise your marketing campaigns, then it is essential to use another analytics platform alongside Google Analytics.
What to do if website traffic levels drop
Experiencing a drop in website traffic can be frustrating, but it happens to everyone at some point. Here’s how to address it:
- Analyse traffic sources: Use analytics tools to pinpoint where the decline is coming from—organic search, referrals, or social media.
- Check for technical issues: Look for broken links or slow loading times, which can deter visitors. Tools like Google Search Console can help identify errors.
- Review recent changes: Consider any recent updates to the website. If something coincided with the drop, it might be worth reverting.
- Evaluate content quality: Ensure the content is engaging and relevant. Update or improve underperforming posts.
- Reassess the marketing strategy: The only constant in marketing is change. It’s wise to periodically revisit the balance between paid ads, social media and other vectors to evaluate their effectiveness and adjust the approach.
It’s perfectly normal for website traffic volumes to fluctuate. Expect it and work with the available tools. Persistence will likely see the traffic volumes rebound.
Get more accurate traffic reports with Matomo
There are several methods to check website traffic. Some can provide estimates on your competitors’ traffic levels. Others, like Google Analytics, are free. But data doesn’t lie. Only privacy-focused analytics solutions like Matomo can provide accurate reports that account for every visitor.
Join over one million organisations using Matomo to check their website traffic accurately and ethically.
Try Matomo for Free
Start your 21-day free trial — no credit card required.
-
Enhanced Privacy Control : Matomo’s Guide for Consent Manager Platform Integrations
In today’s digital landscape, protecting user privacy isn’t just about compliance—it’s about building trust and demonstrating respect for user choices. Even though you can use Matomo without requiring consent when properly configured in compliance with privacy regulations, we’re excited to introduce a new Consent Manager Platforms (CMP) category on our Integrations page to make it easier than ever to implement privacy-respecting analytics.
What’s a consent manager platform?
A Consent Management Platform (CMP) is a tool that helps websites collect, manage, and store user consent for data tracking and cookies in compliance with privacy regulations like GDPR and CCPA. A CMP allows users to choose which types of data they want to share, ensuring transparency and respecting their privacy preferences. By integrating a CMP with Matomo, organisations can make sure that analytics tracking occurs only after obtaining explicit user consent.

Remember, you can configure Matomo to remain fully GDPR compliant, without requiring user consent.
Why consent management matters
With privacy regulations reshaping data collection practices daily, organisations need to ensure that analytics data is gathered only after users have explicitly given their consent. Integrating Matomo with a Consent Management Platform helps you:
- Strengthen regulatory compliance
- Enhance user trust through transparency
- Clearly document consent choices
- Simplify privacy management
By making consent management seamless, you can maintain compliance while delivering a privacy-first experience to your users.
Introducing our CMP integration options
We’ve carefully curated integrations with leading Consent Management Platforms that work seamlessly with Matomo Analytics and Matomo Tag Manager. Our supported platforms include:

Supported consent management platforms
- Osano – Comprehensive consent management with global regulation support
- Cookiebot – Advanced cookie consent and compliance automation
- CookieYes – User-friendly consent management solution
- Tarte au Citron – Open-source consent management tool
- Klaro – Privacy-focused consent management system
- OneTrust – Enterprise-grade privacy management platform
- Complianz for WordPress – Specialised WordPress consent solution
Each platform provides unique features and compliance options, allowing you to select the best fit for your privacy needs.
Getting started with simplified implementation
Ready to enhance your privacy compliance? We’ve made the integration process straightforward, so you can set up a privacy-compliant analytics environment in just a few steps. Here’s how to begin:
- Explore our new CMP category on the Integrations page
- Select and implement the CMP that best suits your needs
- Check our implementation guides for step-by-step instructions
- Configure your consent management settings in Matomo
- Start collecting analytics data with proper consent management
Moving Forward
As privacy regulations evolve and user expectations around data protection grow, proper consent management is more important than ever. With Matomo’s new CMP integrations, you can ensure compliance while maintaining full control over your analytics data.
Visit our Integrations page and our Implementation guides today to explore these privacy-enhancing solutions and take the next step in your privacy-first analytics journey.
-
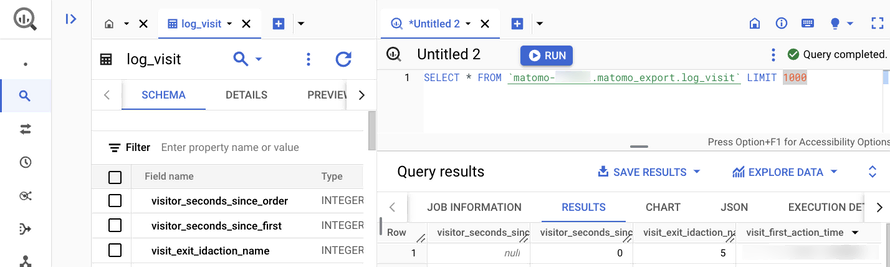
Introducing the Data Warehouse Connector feature
30 janvier, par Matomo Core Team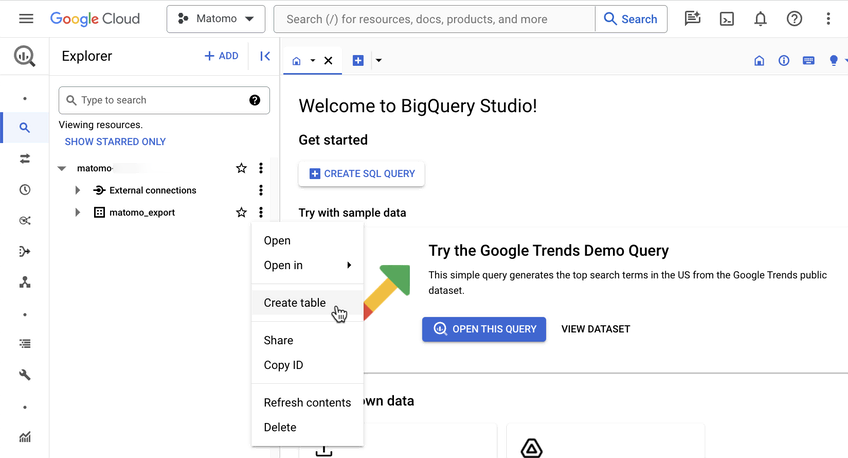
Try Matomo for Free
21 day free trial. No credit card required.


