Recherche avancée

Médias (1)

Mot : - Tags -/punk

Autres articles (85)

  • Amélioration de la version de base

    13 septembre 2013

    Jolie sélection multiple
    Le plugin Chosen permet d’améliorer l’ergonomie des champs de sélection multiple. Voir les deux images suivantes pour comparer.
    Il suffit pour cela d’activer le plugin Chosen (Configuration générale du site > Gestion des plugins), puis de configurer le plugin (Les squelettes > Chosen) en activant l’utilisation de Chosen dans le site public et en spécifiant les éléments de formulaires à améliorer, par exemple select[multiple] pour les listes à sélection multiple (...)

  • Menus personnalisés

    14 novembre 2010, par

    MediaSPIP utilise le plugin Menus pour gérer plusieurs menus configurables pour la navigation.
    Cela permet de laisser aux administrateurs de canaux la possibilité de configurer finement ces menus.
    Menus créés à l’initialisation du site
    Par défaut trois menus sont créés automatiquement à l’initialisation du site : Le menu principal ; Identifiant : barrenav ; Ce menu s’insère en général en haut de la page après le bloc d’entête, son identifiant le rend compatible avec les squelettes basés sur Zpip ; (...)

  • Gestion de la ferme

    2 mars 2010, par

    La ferme est gérée dans son ensemble par des "super admins".
    Certains réglages peuvent être fais afin de réguler les besoins des différents canaux.
    Dans un premier temps il utilise le plugin "Gestion de mutualisation"

Sur d’autres sites (11875)

  • FFMPEG with node , using child_process , suppressing un-necessary stderr

    16 mai 2018, par drexdelta

    I am trying to resize the video using (FFMPEG + node + child_process). and my code looks something like this , You can read comments and understand it. it’s self-explanatory for people who are familiar with node and ffmpeg. when I run this code, I keep getting error in
    newThread.stderr.on() function
    . which is not expected behaviour. After running this process I am getting expected video translation, which is expected behaviour.

    const spawn = require('child_process').spawn;

    // resize and compress video promise  = prom2
    const resizeVideoWith_FFMPEG_Promise = (sourceFile , sinkFile)=>{
       return new Promise ( (resolve , reject)=>{

           // actual command for ffmpeg is something like this , "ffmpeg -i oldVideo -vf scale=-2:480 newVideo"
           // New thread
           const newThread = spawn('ffmpeg' , ['-i','vid1.mp4','-vf','scale=-2:480','vid2.mp4']);

           // on close signal
           newThread.on('close',(data)=>{
               console.log(' thread closed for video ' , sourceFile);
               return resolve();
           });
           // on stderr signals
           newThread.stderr.on('data',(data)=>{
               console.log(' got error in the thread of video ' , sourceFile);
               fullError = data.toString();
               console.log(fullError);
               // return resolve();
               // return reject();
           });
           newThread.stdout.on('data',(data)=>{
               // just ignore all stadanrd outputs
           });
       });
    }

    resizeVideoWith_FFMPEG_Promise('vid1.mp4' , 'vid2.mp4' ).then((res)=>{
       console.log(res);
    });

    For the sake of simplicity I am resolving the promise everytime, even if I get stderr. And at end of running this code I get output something like this ,

    got error in the thread of video  vid1.mp4
    frame= 3277 fps=116 q=28.0 size=   12288kB time=00:02:16.64 bitrate= 736.7kbits/s speed=4.82x    
    got error in the thread of video  vid1.mp4
    frame= 3313 fps=115 q=28.0 size=   12544kB time=00:02:18.15 bitrate= 743.8kbits/s speed=4.79x    
    got error in the thread of video  vid1.mp4
    frame= 3362 fps=115 q=28.0 size=   12800kB time=00:02:20.17 bitrate= 748.0kbits/s speed=4.78x    
    got error in the thread of video  vid1.mp4
    frame= 3408 fps=114 q=28.0 size=   12800kB time=00:02:22.12 bitrate= 737.8kbits/s speed=4.77x    
    got error in the thread of video  vid1.mp4
    frame= 3465 fps=114 q=28.0 size=   13056kB time=00:02:24.49 bitrate= 740.2kbits/s speed=4.76x    
    got error in the thread of video  vid1.mp4
    frame= 3522 fps=114 q=28.0 size=   13312kB time=00:02:26.86 bitrate= 742.5kbits/s speed=4.76x    
    got error in the thread of video  vid1.mp4
    frame= 3580 fps=114 q=28.0 size=   13568kB time=00:02:29.28 bitrate= 744.6kbits/s speed=4.76x

    Now, my problem is if I always keep resolving errors, then I will never be able to catch when the video ACTUALLY FAILED TO RESCALE. so, how can I ignore these type of un-necessary stderr and catch only useful errors ?

    Pls someone help.

    I have been through lot of related links like this, but none of these actually solve my problem(even if they did, I couldn’t figure out)

    Error while using h264_cuvid decoder with ffmpeg

    Using module "child_process" without Webpack

    Suppressing STDOUT with node child_process

    Small hint will be very helpful. Thank you .

    BTW , SO moderators , My actual title was like

    stderr problem while using FFMPEG with node via child_process module

    But it didn’t allow me to use such title. so, I am using some dummy title.

  • Why Matomo is a serious alternative to Google Analytics 360

    12 décembre 2018, par Jake Thornton — Marketing

    There’s no doubt about it, the free version of Google Analytics offers great value when it comes to making data-driven decisions for your business. But as your business starts to grow, so does the need for a more powerful web analytics tool.

    Why would I need to use a different web analytics tool ? It’s because Google Analytics (free version) is very limited when it comes to meeting the needs of a fast growing business whose website plays a pivotal role in converting its customers.

    This is where the Google Analytics 360 suite comes in, which is designed to meet the needs of businesses looking to get more accurate and insightful metrics.

    So what’s holding a growing business back from using Google Analytics 360 ?

    While GA360 sounds like a great option when upgrading your web analytics platform, we have found there are three core reasons holding businesses back from taking the leap :

    • Businesses can’t bear to swallow the US$150,000+ price tag (per year !) that comes with upgrading
    • Businesses can’t rely on GA360 to give them all the insights they need
    • Businesses want more control and ownership of their data

    Thankfully there are (only a few) alternatives and as the leading open-source alternative to Google Analytics, we hope to share insights on why Matomo Analytics can be the perfect solution for anyone at this crossroads in their web analytics journey.

    First, what does Google Analytics 360 offer that Google Analytics (free) doesn’t ?

    There’s no doubt about it, the GA360 suite is designed for larger sized businesses with demanding data limits, big budgets to use across the Google Marketing Platform (Google Adwords, DoubleClick etc.) and to get more advanced reporting visualisations and options.

    Data Sampling

    Data sampling is the elephant in the room when it comes to comparing GA360 with the freemium version. This is an entire article in its own right but at a basic level, Google Analytics samples your data (makes assumptions based on patterns) once the number of traffic visiting your website reaches a certain limit.

    Google Analytics provides the following information :

    Ad-hoc queries of your data are subject to the following general thresholds for sampling :

    Analytics Standard : 500k sessions at the property level for the date range you are using

    Analytics 360 : 100M sessions at the view level for the date range you are using

    In short, sampled data means inaccurate data. This is why as businesses grow, GA360 becomes a more attractive prospect because there’s no point making data-driven business decisions based on inaccurate data. This is a key weapon Google uses when selling to large businesses, however, this may not seem as concerning if you’re a small business within the sampled data range. For small businesses though, make sure you know the full extent of how this can affect your metrics, for example, your ecommerce data could be sampled, hence your GA reporting not matching your CRM/Ecommerce store data.

    Benefit of using Matomo : There is no data sampling anywhere in Matomo Analytics, that’s why we say 100% Accurate Data reporting across all plans.

    All Matomo data is 100% accurate

    Integration with the Google Marketing Platform

    Yes ok, we’ll admit it, GA does a great job at integrating seamlessly with its own products like Google Ads, Google Optimize etc. with a touch of Salesforce integration ; while GA360 takes this to another level compared to it’s freemium version (integration with Google Search 360, Google Display & Video 360 etc.)

    But… what about non-Google advertising platforms ? Well with Google being a dominant leader as a search engine, web browser, email provider, social media channel ; sometimes Google needs to keep its best interests at heart.

    Google is an online advertising giant and a bonus of Google Search 360 is that you can integrate your Bing Ads, Baidu and Yahoo Japan Search campaigns but that’s about it when it comes to integrations from its direct competitors. 

    Benefit of using Matomo : No biased treatment. You can integrate your Google, Yahoo and Bing search consoles for accurate search engine reporting, and in early 2019, Matomo will be releasing a Google Ads, Bing Ads and Facebook Ads Manager integration feature.

    Roll-Up Reporting
    Roll-Up Reporting for Matomo Nalytics

    Roll-up reporting lets you combine multiple accounts and properties into one view. This is a great benefit when upgrading from GA freemium to GA360. For example, if you’re a digital agency with multiple clients or you manage multiple websites under the one account, the roll-up reporting feature is wonderful when you need to combine data and reporting, instantly.

    Benefit of using Matomo : Matomo’s got this covered ! Roll-up reporting is available in the Matomo Business package (starting at $29 per month) for cloud hosting or you can purchase as a Premium Feature for On-Premise starting at $99 per year.

    Staying in full control of your data

    Who would have thought that one of biggest reasons people choose Matomo isn’t because of anything that leads to a higher ROI, but for the fact that users want more control of their data.
    100% Data Ownership with Matomo

    Matomo’s philosophy around data ownership is simple, you own your data, no one else. If you choose to host Matomo Analytics On-Premise then you are in complete control because your data is stored on your own servers where no one can gain access to it in whichever country you choose.

    So what about when you cloud host Matomo ? For users who don’t have the technical knowledge to host Matomo On-Premise, you can still have 100% data ownership and fully respect your user’s privacy when choosing to host Matomo Analytics through our cloud service.

    The difference between cloud hosting Matomo Analytics vs Google Analytics is that when you choose Matomo, we acknowledge you own the data and we have no right to access it. This means we can’t on-sell it to third-parties, we can’t claim ownership of it, you can export your data at anytime (how awesome is that !) and you can migrate between cloud hosting and hosting on-premise for ultimate flexibility whenever you want.

    Matomo also prides itself in allowing its users to be GDPR compliant with ease with a powerful GDPR Manager.

    Businesses can’t rely on Google Analytics 360 to give them all the insights they need

    Unlike Google Analytics 360, Matomo blends its Premium Web Analytics platform with Conversion Optimization features to allow its users to fully evaluate the user-experience on your website.

    Matomo is designed to be a complete analytics platform, meaning you have everything you need all in the one place which gives you greater insights and better business outcomes.

    Matomo Complete Analytics
    These features include :

    Premium Web Analytics – You can still (accurately) measure all the basic metrics you love and are familiar with in Google Analytics like Location, Referrer traffic, Multi Attribution, Campaign Tracking and Ecommerce etc.

    Conversion Optimization – Eliminate the need for multiple analytics tools to get what Google Analytics doesn’t offer. These features include Heatmaps, Session Recordings, Form Analytics and more – giving you the best chance possible to convert more traffic by evaluating the user-experience.

    By having one tool for all your features you can integrate metrics, have one single view for all your data and it’s easy to use.

    Enhanced SEO – Get more insights into the performance of your search campaigns with unbiased search engine reporting, keyword ranking positions, integration with multiple search consoles and crawling stats. Google Analytics offers limited features to help with your SEO campaigns and only integrates with Google products.

    Visitor Profiles – Get a detailed life-time evaluation of every user who visits your website.

    Tag Manager – A powerful open-source Tag Manager tool to embed your third-party marketing tags. By being open-source and with our commitment to giving you 100% data ownership, you can always ensure you are in full control.

    Just putting it out there ...

    Google leads the market with its freemium tool which offers great insights for businesses (fyi – Matomo has a forever free analytics tool too !), but when it comes to upgrading to get accurate reporting (kind of a big deal), owning your own data (a huge deal !) and having a complete range of features to excel ROI for your business, Matomo Analytics is often a preferred option to the Google Analytics 360 suite.

    Matomo is designed to be easy to use, is fully flexible and gives users full peace of mind by respecting user privacy. Want to learn more about the benefits of Matomo ?

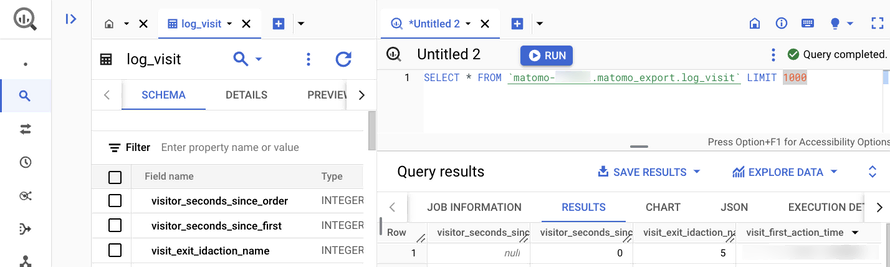
  • Introducing the Data Warehouse Connector feature

    30 janvier, par Matomo Core Team
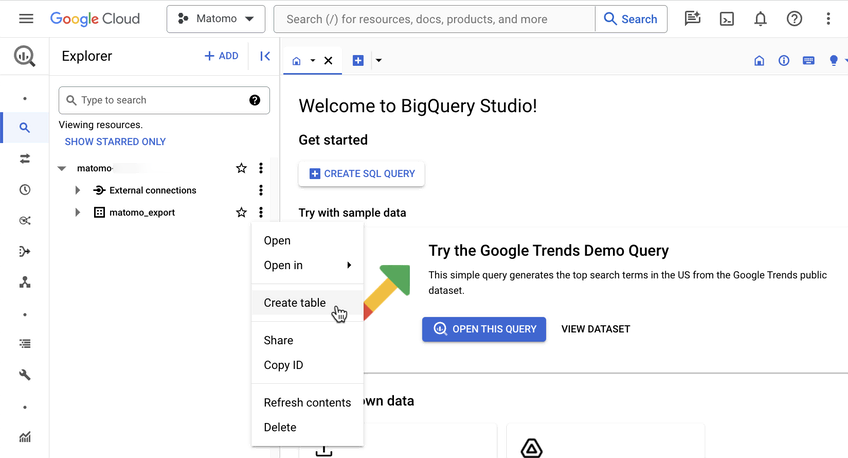
    Matomo is built on a simple truth : your data belongs to you, and you should have complete control over it. That’s why we’re excited to launch our new Data Warehouse Connector feature for Matomo Cloud, giving you even more ways to work with your analytics data. 

    Until now, getting raw data from Matomo Cloud required APIs and custom scripts, or waiting for engineering help.  

    Our new Data Warehouse Connector feature removes those barriers. You can now access your raw, unaggregated data and schedule regular exports straight to your data warehouse. 

    The feature works with all major data warehouses including (but not limited to) : 

    • Google BigQuery 
    • Amazon Redshift 
    • Snowflake 
    • Azure Synapse Analytics 
    • Apache Hive 
    • Teradata 

    You can schedule exports, combine your Matomo data with other data sources in your data warehouse, and easily query data with SQL-like queries. 

    Direct raw data access for greater data portability 

    Waiting for engineering support can delay your work. Managing API connections and writing scripts can be time-consuming. This keeps you from focusing on what you do best—analysing data. 

    BigQuery create-table-menu

    With the Data Warehouse Connector feature, you get direct access to your raw Matomo data without the technical setup. So, you can spend more time analysing data and finding insights that matter. 

    Bringing your data together 

    Answering business questions often requires data from multiple sources. A single customer interaction might span your CRM, web analytics, sales systems, and more. Piecing this data together manually is time-consuming—what starts as a seemingly simple question from stakeholders can turn into hours of work collecting and comparing data across different tools. 

    This feature lets you combine your Matomo data with data from other business systems in your data warehouse. Instead of switching between tools or manually comparing spreadsheets, you can analyse all your data in one place to better understand how customers interact with your business. 

    Easy, custom analysis with SQL-like queries 

    Standard, pre-built reports often don’t address the specific, detailed questions that analysts need to answer.  

    When you use the Data Warehouse Connector feature, you can use SQL-like queries in your data warehouse to do detailed, customised analysis. This flexibility allows you to explore your data in depth and uncover specific insights that aren’t possible with pre-built reports. 

    Here is an example of how you might use SQL-like query to compare the behaviours of paying vs. non-paying users : 

    				
                                            <xmp>SELECT  

    custom_dimension_value AS user_type, -- Assuming 'user_type' is stored in a custom dimension

    COUNT(*) AS total_visits,  

    AVG(visit_total_time) AS avg_duration,

    SUM(conversion.revenue) AS total_spent  

    FROM  

    `your_project.your_dataset.matomo_log_visit` AS visit

    LEFT JOIN  

    `your_project.your_dataset.matomo_log_conversion` AS conversion  

    ON  

    visit.idvisit = conversion.idvisit  

    GROUP BY  

    custom_dimension_value; </xmp>
                                   

    This query helps you compare metrics such as the number of visits, average session duration, and total amount spent between paying and non-paying users. It provides a full view of behavioural differences between these groups. 

    Advanced data manipulation and visualisation 

    When you need to create detailed reports or dive deep into data analysis, working within the constraints of a fixed user interface (UI) can limit your ability to draw insights. 

    Exporting your Matomo data to a data warehouse like BigQuery provides greater flexibility for in-depth manipulation and advanced visualisations, enabling you to uncover deeper insights and tailor your reports more effectively. 

    Getting started 

    To set up data warehouse exports in your Matomo : 

    1. Go to System Admin (cog icon in the top right corner) 
    2. Select ‘Export’ from the left-hand menu 
    3. Choose ‘Data Warehouse Connector’ 

    You’ll find detailed instructions in our data warehouse exports guide 

    Please note, enabling this feature will cost an additional 10% of your current subscription. You can view the exact cost by following the steps above. 

    New to Matomo ? Start your 21-day free trial now (no credit card required), or request a demo.