Recherche avancée
Médias (1)
-

Carte de Schillerkiez
13 mai 2011, par
Mis à jour : Septembre 2011
Langue : English
Type : Texte
Autres articles (76)
-
MediaSPIP 0.1 Beta version
25 avril 2011, parMediaSPIP 0.1 beta is the first version of MediaSPIP proclaimed as "usable".
The zip file provided here only contains the sources of MediaSPIP in its standalone version.
To get a working installation, you must manually install all-software dependencies on the server.
If you want to use this archive for an installation in "farm mode", you will also need to proceed to other manual (...) -
Multilang : améliorer l’interface pour les blocs multilingues
18 février 2011, parMultilang est un plugin supplémentaire qui n’est pas activé par défaut lors de l’initialisation de MediaSPIP.
Après son activation, une préconfiguration est mise en place automatiquement par MediaSPIP init permettant à la nouvelle fonctionnalité d’être automatiquement opérationnelle. Il n’est donc pas obligatoire de passer par une étape de configuration pour cela. -
Les notifications de la ferme
1er décembre 2010, parAfin d’assurer une gestion correcte de la ferme, il est nécessaire de notifier plusieurs choses lors d’actions spécifiques à la fois à l’utilisateur mais également à l’ensemble des administrateurs de la ferme.
Les notifications de changement de statut
Lors d’un changement de statut d’une instance, l’ensemble des administrateurs de la ferme doivent être notifiés de cette modification ainsi que l’utilisateur administrateur de l’instance.
À la demande d’un canal
Passage au statut "publie"
Passage au (...)
Sur d’autres sites (5750)
-
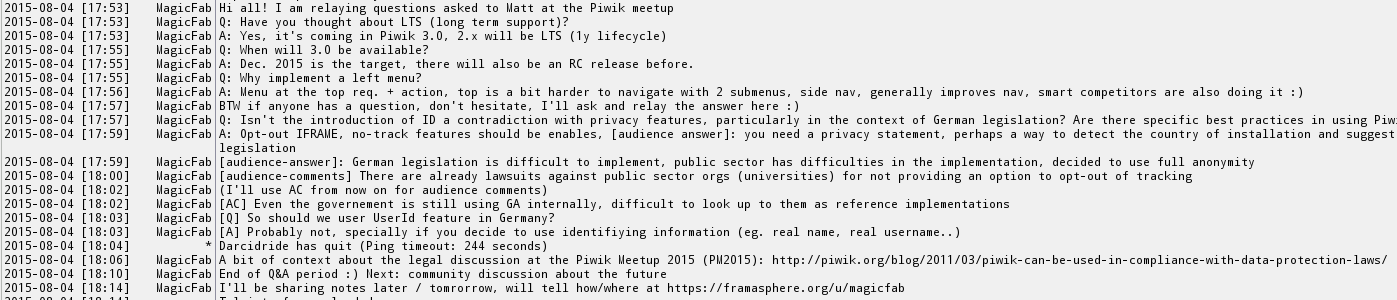
A *hot* Piwik Community Meetup 2015 !
10 août 2015, par André Bräkling — CommunityLast weekend I arrived in Germany to attend the Piwik Community Meetup 2015 and now I am in Poland.
The meetup was HOT in every sense ! Berlin temperatures reached 35 degrees (celsius), as I finally meet in person several long-time, dedicated Piwik community contributors.

Meetup preparation in Berlin, photo by M. Zawadziński, licensed under CC-BY-SA 4.0
Pictures from the meetup preparation sessions
In the first leg of my trip I was in Berlin to meet Piwik community members to prepare for the 2015 annual Piwik community meetup. These are my notes taken during the meeting at the request of one of my colleagues. I also relayed live on Framasphère, Twitter and IRC.

Community discussion at the meetup, photo by D.Czajka, licensed under CC-BY-SA 4.0
More pictures from the Piwik meetup
This was harder than I expected, as I took notes with my laptop, pictures with my phone, wrote live to social media (using the Android Diaspora Native Web App), and used my laptop to relay on IRC. Going forward this requires better preparation, I was glad I had a few links and pictures ready before hand but it really requires intense focus to achieve this. I am glad presenters were patient when I requested repeating some of the ideas they shared. I am also a bit disappointed not much happened in IRC.
Two day preparation sessions
The discussions and session we had during the two days prior to the meetup are available here.
We gathered in rented apartments in Berlin, this reminded me very much of similar community gatherings and perhaps of BarCamp and, at a much smaller scale, UDS sessions.

Piwik Pizza !, photo by F. Rodríguez, licensed under CC-BY-SA 4.0
A list of ideas of topics was initially submitted, we then proceeded to have scheduled sessions for open discussion. Several people shared their concern there was no possible remote participation which led to making public the Trello boards used/linked here.
Note : The Trello links below still have action items and notes that are pending bug report / feature requests filing which should happen over the coming weeks. Most importantly, many action items will need identifying leads for different community team including Translations and Documentation, and better coordination of coming community engagement.
Monday sessions consisted of the following subjects :
- What are Piwik values & how to communicate them ? (see below for details)
- How to encourage and recognize new external contributors ?
- How could we double the Piwik userbase ?
- How Community can organise help resources
On Tuesday we met again to discuss the following subjects :
- Piwik Long Term support (LTS)
- How do Piwik.org (project) and Piwik PRO (company) sit together / are organized ? – An important part of this session was about having better communication channels and improving the new team page (bug #8520 and bug #8519, respectively)
- Improving usability of Piwik e.g. for new users – this last session was not held has we ran out of time and prepared to go to the meetup venue.
Some more details about individual preparation sessions
What are Piwik values & how to communicate them ?
The main subjects in this session were important changes proposed in the project mission and values. This was edited directly on on the wiki page on GitHub, some of the changes can be seen by comparing revisions.
Piwik mission statement (bug #7376)
“To create the leading Free and open source analytics platform, and to support global organisations and communities to keep full control over their data.”
Our values
- Openness
- Freedom
- Transparency
- Data ownership
- Privacy
- Kaizen (改善) : continuous improvement
This was also presented by Matthieu Aubry at the meetup and is published in the Roadmap page. Bringing more visibility and perhaps having a top page for Mission and Values was also brought up.
Meetup agenda and notes
The official agenda is available here.
Many Piwik PRO employees stayed in Berlin for the meetup, and we had good participation although less than last year in Munich as my colleagues told me. Some were consultants, others staff from public organizations, universities, etc. In retrospect considering the very hot weather and summer holidays the attendance was good. I was very happy to arrive at the beautiful Kulturbrauerei and enter the air-conditioned Soda Club. T-Shirts were waiting for all attendees and free drinks (non-alcohol !) were welcome

-
How to increase engagement and convert them into customers
8 septembre 2020, par Joselyn Khor — Analytics Tips, MarketingLong gone are the days of simply tracking page views as a measure of engagement. Now it’s about engagement analysis, which is layered and provides insight for effective data-driven decisions.
Discover how engaged people are with your website by uncovering behavioural patterns that tell you how well your site and content is or isn’t performing. This insight helps you re-evaluate, adapt and optimise your content and strategy. The more engaged they are, the more likely you’ll be able to guide them on a predetermined journey that results in more conversions ; and helps you reach the goals you’ve set for your business.
Why is visitor engagement important ?
It’s vital to measure engagement if you have anything content related that plays a role in your customer’s journey. Some websites may find more value in figuring out how engaging their entire site is, while others may only want to zone in on, say, a blogging section, e-newsletters, social media channels or sign-up pages.
In the larger scheme of things, engagement can be seen as what’s running your site. Every aspect of the buyer’s journey requires your visitors to be engaged. Whether you’re trying to attract, convert or build a loyal audience base, you need to know your content is optimised to maintain their attention and encourage them along the path to purchase, conversion or loyalty.
How to increase engagement with Matomo
You need to know what’s going right or wrong to eventually be able to deliver more riveting content your visitors can’t help but be drawn to. Learn how to apply Matomo’s easy-to-use features to increase engagement :
- The Behaviour feature
- Heatmaps
- A/B Testing
- Media Analytics
- Transitions
- Custom reports
- Other metrics to keep an eye on
1. Look at the Behaviour feature
It allows you to learn how visitors are responding to your content. This information is gathered by drawing insight from features such as site search, downloads, events and content interactions. Learn more

Matomo’s top five ways to increase engagement with the Behaviour feature :
Behaviour -> Pages
Get complete insights on what pages your users engage with, what pages provide little value to your business and see the results of entry and exit pages. If important content is generating low traffic, you need to place it where it can be seen. Spend time where it matters and focus on the content that will engage with your users and see how it eventually converts them into customers.Behaviour -> Site search
Site search tracks how people use your website’s internal search engine. You can see :- What search keywords visitors used on your website’s internal search.
- Which of those keywords resulted in no results (what content your visitors are looking for but cannot find).
- What pages visitors visited immediately after a search.
- What search categories visitors use (if your website employs search categories).
Behaviour -> Downloads
What are users wanting to take away with them ? They could be downloading .pdfs, .zip files, ebooks, infographics or other free/paid resources. For example, if you were working for an education institution and created valuable information packs for students that you made available online in .pdf format. To see an increase in downloads meant students were finding the .pdfs and realising the need to download them. No downloads could mean the information packs weren’t being found which would be problematic.Behaviour -> Events
Tracking events is a very useful way to measure the interactions your users have with your website content, which are not directly page views or downloads.How have Events been used effectively ? A great example comes from one of our customers, Catalyst. They wanted to capture and measure the user interaction of accordions (an area of content that expands or closes depending on how a user interacts with it) to see if people were actually getting all the information available to them on this one page. By creating an Event to record which accordion had been opened, as well as creating events for other user interactions, they were able to figure out which content got the most engagement and which got the least. Being able to see how visitors navigated through their website helped them optimise the site to ensure people were getting the relevant information they were craving.
Behaviour -> Content interactions
Content tracking allows you to track interaction within the content of your web page. Go beyond page views, bounce rates and average time spent on page with your content. Instead, you can analyse content interaction rates based on mouse clicking and configuring scrolling or hovering behaviours to see precisely how engaged your users are. If interaction rates are low, perhaps you need to restructure your page layout to grab your user’s attention sooner. Possibly you will get more interaction when you have more images or banner ads to other areas of your business.
Watch this video to learn about the Behaviour feature
2. Set up Heatmaps
Effortlessly discover how your visitors truly engage with your most important web pages that impact the success of your business. Heatmaps shows you visually where your visitors try to click, move the mouse and how far down they scroll on each page.

You don’t need to waste time digging for key metrics or worry about putting together tables of data to understand how your visitors are interacting with your website. Heatmaps make it easy and fast to discover where your users are paying their attention, where they have problems, where useless content is and how engaging your content is. Get insights that you cannot get from traditional reports. Learn more
3. Carry out A/B testing
With A/B Testing you reduce risk in your decision-making and can test what your visitors are responding well to.

Ever had discussions with colleagues about where to place content on a landing page ? Or discussed what the call-to-action should be and assumed you were making the best decisions ? The truth is, you never know what really works the best (and what doesn’t) unless you test it. Learn more
How to increase engagement with A/B Testing : Test, test and test. This is a surefire way to learn what content is leading your visitors on a path to conversion and what isn’t.
4. Media Analytics
Tells you how visitors are engaging with your video or audio content, and whether they’re leading to your desired conversions. Track :
- How many plays your media gets and which parts they viewed
- Finish rates
- How your media was consumed over time
- How media was consumed on specific days
- Which locations your users were viewing your content from
- Learn more

How to increase engagement with Media Analytics : These metrics give a picture of how audiences are behaving when it comes to your content. By showing insights such as, how popular your media content is, how engaging it is and which days content will be most viewed, you can tailor content strategies to produce content people will actually find interesting and watch/listen.
Matomo example : When we went through the feature video metrics on our own site to see how our videos were performing, we noticed our Acquisition video had a 95% completion rate. Even though it was longer than most videos, the stats showed us it had, by far, the most engagement. By using Media Analytics to get insights on the best and worst performing videos, we gathered useful info to help us better allocate resources effectively so that in the future, we’re producing more videos that will be watched.
5. Investigate transitions
See which page visitors are entering the site from and where they exit to. Transitions shows engagement on each page and whether the content is leading them to the pages you want them to be directed to.

This gives you a greater understanding of user pathways. You may be assuming visitors are finding your content from one particular pathway, but figure out users are actually coming through other channels you never thought of. Through Transitions, you may discover and capitalise on new opportunities from external sites.
How to increase engagement with Transitions : Identify clearly where users may be getting distracted to click away and where other pages are creating opportunity to click-through to conversion.
6. Create Custom Reports
You can choose from over 200 dimensions and metrics to get the insights you need as well as various visualisation options. This makes understanding the data incredibly easy and you can get the insights you need instantly for faster results without the need for a developer. Learn more

How to increase engagement with Custom Reports : Set custom reports to see when content is being viewed and figure out how engaged users are by looking at different hours of the day or which days of the week they’re visiting your website. For example, you could be wondering what hour of the day performed best for converting your customers. Understanding these metrics helps you figure out the best time to schedule your blog posts, pay-per-click advertising, edms or social media posts knowing that your visitors are more likely to convert at different times.
7. Other metrics to key an eye on …
A good indication of a great experience and of engagement is whether your readers, viewers or listeners want to do it again and again.
“Best” metrics are hard to determine so you’ll need to ask yourself what you want to do or what you want your site to do. How do you want your users to behave or what kind of buyer’s journey do you want them to have ?
Want to know where to start ? Look at …
- Bounce rate – a high bounce rate isn’t great as people aren’t finding what they’re looking for and are leaving without taking action. (This offers great opportunities as you can test to see why people are bouncing off your site and figure out what you need to change.)
- Time on site – a long time on site is usually a good indication that people are spending time reading, navigating and being engaged with your website.
- Frequency of visit – how often do people come back to interact with the content on your website ? The higher the % of your visitors that come back time and time again will show how engaged they are with your content.
- Session length/average session duration – how much time users spend on site each session
- Pages per session – is great to show engagement because it shows visitors are happy going through your website and learn more about your business.
Key takeaway
Whichever stage of the buyer’s journey your visitors are in, you need to ensure your content is optimised for engagement so that visitors can easily spend time on your website.
“Every single visit by every single visitor is no longer judged as a success or a failure at the end of 29 min (max) session in your analytics tool. Every visit is not a ‘last-visit’, rather it becomes a continuous experience leading to a win-win outcome.” – Avinash Kaushik
As you can tell, one size does not fit all when it comes to analysing and measuring engagement, but with a toolkit of features, you can make sure you have everything you need to experiment and figure out the metrics that matter to the success of your business and website.
Concurrently, these gentle nudges for visitors to consume more and more content encourages them along their path to purchase, conversion or loyalty. They get a more engaging website experience over time and you get happy visitors/customers who end up coming back for more.
Want to learn how to increase conversions with Matomo ? Look out for the final in this series : part 3 ! We’ll go through how you can boost conversions and meet your business goals with web analytics.
-
Your 6-step guide to increasing acquisition
2 juillet 2019, par Matomo Core Team — Analytics Tips


