Recherche avancée

Médias (1)

Mot : - Tags -/ogg

Autres articles (43)

  • MediaSPIP Core : La Configuration

    9 novembre 2010, par

    MediaSPIP Core fournit par défaut trois pages différentes de configuration (ces pages utilisent le plugin de configuration CFG pour fonctionner) : une page spécifique à la configuration générale du squelettes ; une page spécifique à la configuration de la page d’accueil du site ; une page spécifique à la configuration des secteurs ;
    Il fournit également une page supplémentaire qui n’apparait que lorsque certains plugins sont activés permettant de contrôler l’affichage et les fonctionnalités spécifiques (...)

  • Le plugin : Podcasts.

    14 juillet 2010, par

    Le problème du podcasting est à nouveau un problème révélateur de la normalisation des transports de données sur Internet.
    Deux formats intéressants existent : Celui développé par Apple, très axé sur l’utilisation d’iTunes dont la SPEC est ici ; Le format "Media RSS Module" qui est plus "libre" notamment soutenu par Yahoo et le logiciel Miro ;
    Types de fichiers supportés dans les flux
    Le format d’Apple n’autorise que les formats suivants dans ses flux : .mp3 audio/mpeg .m4a audio/x-m4a .mp4 (...)

  • Les autorisations surchargées par les plugins

    27 avril 2010, par

    Mediaspip core
    autoriser_auteur_modifier() afin que les visiteurs soient capables de modifier leurs informations sur la page d’auteurs

Sur d’autres sites (7692)

  • Why Matomo is a serious alternative to Google Analytics 360

    12 décembre 2018, par Jake Thornton — Marketing

    There’s no doubt about it, the free version of Google Analytics offers great value when it comes to making data-driven decisions for your business. But as your business starts to grow, so does the need for a more powerful web analytics tool.

    Why would I need to use a different web analytics tool ? It’s because Google Analytics (free version) is very limited when it comes to meeting the needs of a fast growing business whose website plays a pivotal role in converting its customers.

    This is where the Google Analytics 360 suite comes in, which is designed to meet the needs of businesses looking to get more accurate and insightful metrics.

    So what’s holding a growing business back from using Google Analytics 360 ?

    While GA360 sounds like a great option when upgrading your web analytics platform, we have found there are three core reasons holding businesses back from taking the leap :

    • Businesses can’t bear to swallow the US$150,000+ price tag (per year !) that comes with upgrading
    • Businesses can’t rely on GA360 to give them all the insights they need
    • Businesses want more control and ownership of their data

    Thankfully there are (only a few) alternatives and as the leading open-source alternative to Google Analytics, we hope to share insights on why Matomo Analytics can be the perfect solution for anyone at this crossroads in their web analytics journey.

    First, what does Google Analytics 360 offer that Google Analytics (free) doesn’t ?

    There’s no doubt about it, the GA360 suite is designed for larger sized businesses with demanding data limits, big budgets to use across the Google Marketing Platform (Google Adwords, DoubleClick etc.) and to get more advanced reporting visualisations and options.

    Data Sampling

    Data sampling is the elephant in the room when it comes to comparing GA360 with the freemium version. This is an entire article in its own right but at a basic level, Google Analytics samples your data (makes assumptions based on patterns) once the number of traffic visiting your website reaches a certain limit.

    Google Analytics provides the following information :

    Ad-hoc queries of your data are subject to the following general thresholds for sampling :

    Analytics Standard : 500k sessions at the property level for the date range you are using

    Analytics 360 : 100M sessions at the view level for the date range you are using

    In short, sampled data means inaccurate data. This is why as businesses grow, GA360 becomes a more attractive prospect because there’s no point making data-driven business decisions based on inaccurate data. This is a key weapon Google uses when selling to large businesses, however, this may not seem as concerning if you’re a small business within the sampled data range. For small businesses though, make sure you know the full extent of how this can affect your metrics, for example, your ecommerce data could be sampled, hence your GA reporting not matching your CRM/Ecommerce store data.

    Benefit of using Matomo : There is no data sampling anywhere in Matomo Analytics, that’s why we say 100% Accurate Data reporting across all plans.

    All Matomo data is 100% accurate

    Integration with the Google Marketing Platform

    Yes ok, we’ll admit it, GA does a great job at integrating seamlessly with its own products like Google Ads, Google Optimize etc. with a touch of Salesforce integration ; while GA360 takes this to another level compared to it’s freemium version (integration with Google Search 360, Google Display & Video 360 etc.)

    But… what about non-Google advertising platforms ? Well with Google being a dominant leader as a search engine, web browser, email provider, social media channel ; sometimes Google needs to keep its best interests at heart.

    Google is an online advertising giant and a bonus of Google Search 360 is that you can integrate your Bing Ads, Baidu and Yahoo Japan Search campaigns but that’s about it when it comes to integrations from its direct competitors. 

    Benefit of using Matomo : No biased treatment. You can integrate your Google, Yahoo and Bing search consoles for accurate search engine reporting, and in early 2019, Matomo will be releasing a Google Ads, Bing Ads and Facebook Ads Manager integration feature.

    Roll-Up Reporting
    Roll-Up Reporting for Matomo Nalytics

    Roll-up reporting lets you combine multiple accounts and properties into one view. This is a great benefit when upgrading from GA freemium to GA360. For example, if you’re a digital agency with multiple clients or you manage multiple websites under the one account, the roll-up reporting feature is wonderful when you need to combine data and reporting, instantly.

    Benefit of using Matomo : Matomo’s got this covered ! Roll-up reporting is available in the Matomo Business package (starting at $29 per month) for cloud hosting or you can purchase as a Premium Feature for On-Premise starting at $99 per year.

    Staying in full control of your data

    Who would have thought that one of biggest reasons people choose Matomo isn’t because of anything that leads to a higher ROI, but for the fact that users want more control of their data.
    100% Data Ownership with Matomo

    Matomo’s philosophy around data ownership is simple, you own your data, no one else. If you choose to host Matomo Analytics On-Premise then you are in complete control because your data is stored on your own servers where no one can gain access to it in whichever country you choose.

    So what about when you cloud host Matomo ? For users who don’t have the technical knowledge to host Matomo On-Premise, you can still have 100% data ownership and fully respect your user’s privacy when choosing to host Matomo Analytics through our cloud service.

    The difference between cloud hosting Matomo Analytics vs Google Analytics is that when you choose Matomo, we acknowledge you own the data and we have no right to access it. This means we can’t on-sell it to third-parties, we can’t claim ownership of it, you can export your data at anytime (how awesome is that !) and you can migrate between cloud hosting and hosting on-premise for ultimate flexibility whenever you want.

    Matomo also prides itself in allowing its users to be GDPR compliant with ease with a powerful GDPR Manager.

    Businesses can’t rely on Google Analytics 360 to give them all the insights they need

    Unlike Google Analytics 360, Matomo blends its Premium Web Analytics platform with Conversion Optimization features to allow its users to fully evaluate the user-experience on your website.

    Matomo is designed to be a complete analytics platform, meaning you have everything you need all in the one place which gives you greater insights and better business outcomes.

    Matomo Complete Analytics
    These features include :

    Premium Web Analytics – You can still (accurately) measure all the basic metrics you love and are familiar with in Google Analytics like Location, Referrer traffic, Multi Attribution, Campaign Tracking and Ecommerce etc.

    Conversion Optimization – Eliminate the need for multiple analytics tools to get what Google Analytics doesn’t offer. These features include Heatmaps, Session Recordings, Form Analytics and more – giving you the best chance possible to convert more traffic by evaluating the user-experience.

    By having one tool for all your features you can integrate metrics, have one single view for all your data and it’s easy to use.

    Enhanced SEO – Get more insights into the performance of your search campaigns with unbiased search engine reporting, keyword ranking positions, integration with multiple search consoles and crawling stats. Google Analytics offers limited features to help with your SEO campaigns and only integrates with Google products.

    Visitor Profiles – Get a detailed life-time evaluation of every user who visits your website.

    Tag Manager – A powerful open-source Tag Manager tool to embed your third-party marketing tags. By being open-source and with our commitment to giving you 100% data ownership, you can always ensure you are in full control.

    Just putting it out there ...

    Google leads the market with its freemium tool which offers great insights for businesses (fyi – Matomo has a forever free analytics tool too !), but when it comes to upgrading to get accurate reporting (kind of a big deal), owning your own data (a huge deal !) and having a complete range of features to excel ROI for your business, Matomo Analytics is often a preferred option to the Google Analytics 360 suite.

    Matomo is designed to be easy to use, is fully flexible and gives users full peace of mind by respecting user privacy. Want to learn more about the benefits of Matomo ?

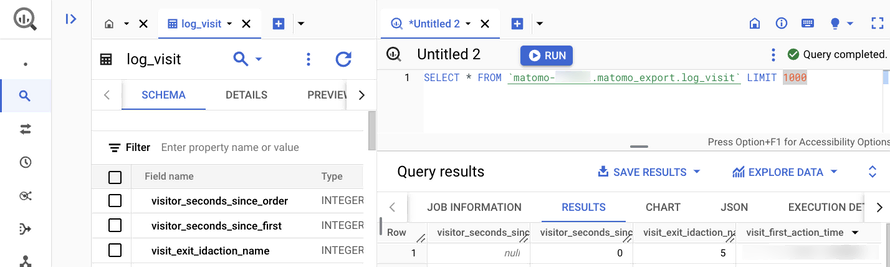
  • Introducing the Data Warehouse Connector feature

    30 janvier, par Matomo Core Team
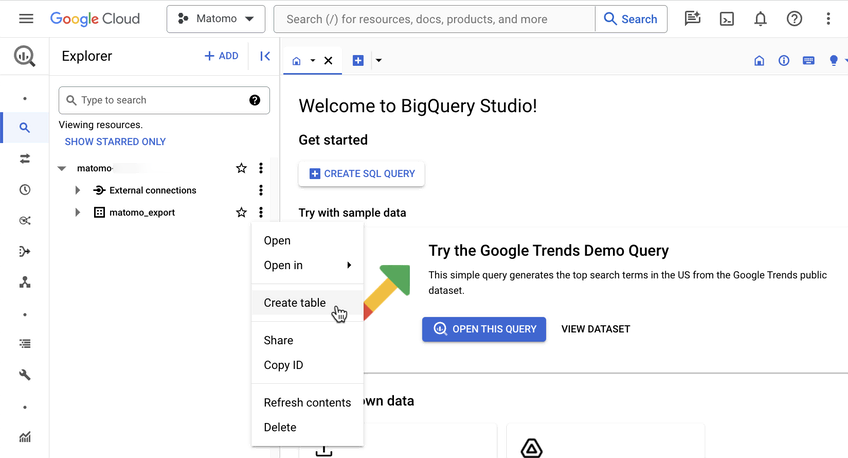
    Matomo is built on a simple truth : your data belongs to you, and you should have complete control over it. That’s why we’re excited to launch our new Data Warehouse Connector feature for Matomo Cloud, giving you even more ways to work with your analytics data. 

    Until now, getting raw data from Matomo Cloud required APIs and custom scripts, or waiting for engineering help.  

    Our new Data Warehouse Connector feature removes those barriers. You can now access your raw, unaggregated data and schedule regular exports straight to your data warehouse. 

    The feature works with all major data warehouses including (but not limited to) : 

    • Google BigQuery 
    • Amazon Redshift 
    • Snowflake 
    • Azure Synapse Analytics 
    • Apache Hive 
    • Teradata 

    You can schedule exports, combine your Matomo data with other data sources in your data warehouse, and easily query data with SQL-like queries. 

    Direct raw data access for greater data portability 

    Waiting for engineering support can delay your work. Managing API connections and writing scripts can be time-consuming. This keeps you from focusing on what you do best—analysing data. 

    BigQuery create-table-menu

    With the Data Warehouse Connector feature, you get direct access to your raw Matomo data without the technical setup. So, you can spend more time analysing data and finding insights that matter. 

    Bringing your data together 

    Answering business questions often requires data from multiple sources. A single customer interaction might span your CRM, web analytics, sales systems, and more. Piecing this data together manually is time-consuming—what starts as a seemingly simple question from stakeholders can turn into hours of work collecting and comparing data across different tools. 

    This feature lets you combine your Matomo data with data from other business systems in your data warehouse. Instead of switching between tools or manually comparing spreadsheets, you can analyse all your data in one place to better understand how customers interact with your business. 

    Easy, custom analysis with SQL-like queries 

    Standard, pre-built reports often don’t address the specific, detailed questions that analysts need to answer.  

    When you use the Data Warehouse Connector feature, you can use SQL-like queries in your data warehouse to do detailed, customised analysis. This flexibility allows you to explore your data in depth and uncover specific insights that aren’t possible with pre-built reports. 

    Here is an example of how you might use SQL-like query to compare the behaviours of paying vs. non-paying users : 

    				
                                            <xmp>SELECT  

    custom_dimension_value AS user_type, -- Assuming 'user_type' is stored in a custom dimension

    COUNT(*) AS total_visits,  

    AVG(visit_total_time) AS avg_duration,

    SUM(conversion.revenue) AS total_spent  

    FROM  

    `your_project.your_dataset.matomo_log_visit` AS visit

    LEFT JOIN  

    `your_project.your_dataset.matomo_log_conversion` AS conversion  

    ON  

    visit.idvisit = conversion.idvisit  

    GROUP BY  

    custom_dimension_value; </xmp>
                                   

    This query helps you compare metrics such as the number of visits, average session duration, and total amount spent between paying and non-paying users. It provides a full view of behavioural differences between these groups. 

    Advanced data manipulation and visualisation 

    When you need to create detailed reports or dive deep into data analysis, working within the constraints of a fixed user interface (UI) can limit your ability to draw insights. 

    Exporting your Matomo data to a data warehouse like BigQuery provides greater flexibility for in-depth manipulation and advanced visualisations, enabling you to uncover deeper insights and tailor your reports more effectively. 

    Getting started 

    To set up data warehouse exports in your Matomo : 

    1. Go to System Admin (cog icon in the top right corner) 
    2. Select ‘Export’ from the left-hand menu 
    3. Choose ‘Data Warehouse Connector’ 

    You’ll find detailed instructions in our data warehouse exports guide 

    Please note, enabling this feature will cost an additional 10% of your current subscription. You can view the exact cost by following the steps above. 

    New to Matomo ? Start your 21-day free trial now (no credit card required), or request a demo. 

  • Is Google Analytics Accurate ? 6 Important Caveats

    8 novembre 2022, par Erin

    It’s no secret that accurate website analytics is crucial for growing your online business — and Google Analytics is often the go-to source for insights. 

    But is Google Analytics data accurate ? Can you fully trust the provided numbers ? Here’s a detailed explainer.

    How Accurate is Google Analytics ? A Data-Backed Answer 

    When properly configured, Google Analytics (Universal Analytics and Google Analytics 4) is moderately accurate for global traffic collection. That said : Google Analytics doesn’t accurately report European traffic. 

    According to GDPR provisions, sites using GA products must display a cookie consent banner. This consent is required to collect third-party cookies — a tracking mechanism for identifying users across web properties.

    Google Analytics (GA) cannot process data about the user’s visit if they rejected cookies. In such cases, your analytics reports will be incomplete.

    Cookie rejection refers to visitors declining or blocking cookies from ever being collected by a specific website (or within their browser). It immediately affects the accuracy of all metrics in Google Analytics.

    Google Analytics is not accurate in locations where cookie consent to tracking is legally required. Most consumers don’t like disruptive cookie banners or harbour concerns about their privacy — and chose to reject tracking. 

    This leaves businesses with incomplete data, which, in turn, results in : 

    • Lower traffic counts as you’re not collecting 100% of the visitor data. 
    • Loss of website optimisation capabilities. You can’t make data-backed decisions due to inconsistent reporting

    For the above reasons, many companies now consider cookieless website tracking apps that don’t require consent screen displays. 

    Why is Google Analytics Not Accurate ? 6 Causes and Solutions 

    A high rejection rate of cookie banners is the main reason for inaccurate Google Analytics reporting. In addition, your account settings can also hinder Google Analytics’ accuracy.

    If your analytics data looks wonky, check for these six Google Analytics accuracy problems. 

    You Need to Secure Consent to Cookies Collection 

    To be GDPR-compliant, you must display a cookie consent screen to all European users. Likewise, other jurisdictions and industries require similar measures for user data collection. 

    This is a nuisance for many businesses since cookie rejection undermines their remarketing capabilities. Hence, some try to maximise cookie acceptance rates with dark patterns. For example : hide the option to decline tracking or make the texts too small. 

    Cookie consent banner examples
    Banner on the left doesn’t provide an evident option to reject all cookies and nudges the user to accept tracking. Banner on the right does a better job explaining the purpose of data collection and offers a straightforward yes/no selection

    Sadly, not everyone’s treating users with respect. A joint study by German and American researchers found that only 11% of US websites (from a sample of 5,000+) use GDPR-compliant cookie banners.

    As a result, many users aren’t aware of the background data collection to which they have (or have not) given consent. Another analysis of 200,000 cookies discovered that 70% of third-party marketing cookies transfer user data outside of the EU — a practice in breach of GDPR.

    Naturally, data regulators and activities are after this issue. In April 2022, Google was pressured to introduce a ‘reject all’ cookies button to all of its products (a €150 million compliance fine likely helped with that). Whereas, noyb has lodged over 220 complaints against individual websites with deceptive cookie consent banners.

    The takeaway ? Messing up with the cookie consent mechanism can get you in legal trouble. Don’t use sneaky banners as there are better ways to collect website traffic statistics. 

    Solution : Try Matomo GDPR-Friendly Analytics 

    Fill in the gaps in your traffic analytics with Matomo – a fully GDPR-compliant product that doesn’t rely on third-party cookies for tracking web visitors. Because of how it is designed, the French data protection authority (CNIL) confirmed that Matomo can be used to collect data without tracking consent.

    With Matomo, you can track website users without asking for cookie consent. And when you do, we supply you with a compact, compliant, non-disruptive cookie banner design. 

    Your Google Tag Isn’t Embedded Correctly 

    Google Tag (gtag.js) is a web tracking script that sends data to your Google Analytics, Google Ads and Google Marketing Platform.

    A corrupted gtag.js installation can create two accuracy issues : 

    • Duplicate page tracking 
    • Missing script installation 

    Is there a way to tell if you’re affected ?

    Yes. You may have duplicate scripts installed if you have a very low bounce rate on most website pages (below 15% – 20%). The above can happen if you’re using a WordPress GA plugin and additionally embed gtag.js straight in your website code. 

    A tell-tale sign of a missing script on some pages is low/no traffic stats. Google alerts you about this with a banner : 

    Google Analytics alerts

    Solution : Use Available Troubleshooting Tools 

    Use Google Analytics Debugger extension to analyse pages with low bounce rates. Use the search bar to locate duplicate code-tracking elements. 

    Alternatively, you can use Google Tag Assistant for diagnosing snippet install and troubleshooting issues on individual pages. 

    If the above didn’t work, re-install your analytics script

    Machine Learning and Blended Data Are Applied

    Google Analytics 4 (GA4) relies a lot on machine learning and algorithmic predictions.

    By applying Google’s advanced machine learning models, the new Analytics can automatically alert you to significant trends in your data. [...] For example, it calculates churn probability so you can more efficiently invest in retaining customers.

    On the surface, the above sounds exciting. In practice, Google’s application of predictive algorithms means you’re not seeing actual data. 

    To offer a variation of cookieless tracking, Google algorithms close the gaps in reporting by creating models (i.e., data-backed predictions) instead of reporting on actual user behaviours. Therefore, your GA4 numbers may not be accurate.

    For bigger web properties (think websites with 1+ million users), Google also relies on data sampling — a practice of extrapolating data analytics, based on a data subset, rather than the entire dataset. Once again, this can lead to inconsistencies in reporting with some numbers (e.g., average conversion rates) being inflated or downplayed. 

    Solution : Try an Alternative Website Analytics App 

    Unlike GA4, Matomo reports consist of 100% unsampled data. All the aggregated reporting you see is based on real user data (not guesstimation). 

    Moreover, you can migrate from Universal Analytics (UA) to Matomo without losing access to your historical records. GA4 doesn’t yet have any backward compatibility.

    Spam and Bot Traffic Isn’t Filtered Out 

    Surprise ! 42% of all Internet traffic is generated by bots, of which 27.7% are bad ones.

    Good bots (aka crawlers) do essential web “housekeeping” tasks like indexing web pages. Bad bots distribute malware, spam contact forms, hack user accounts and do other nasty stuff. 

    A lot of such spam bots are designed specifically for web analytics apps. The goal ? Flood your dashboard with bogus data in hopes of getting some return action from your side. 

    Types of Google Analytics Spam :

    • Referral spam. Spambots hijack the referrer, displayed in your GA referral traffic report to indicate a page visit from some random website (which didn’t actually occur). 
    • Event spam. Bots generate fake events with free language entries enticing you to visit their website. 
    • Ghost traffic spam. Malicious parties can also inject fake pageviews, containing URLs that they want you to click. 

    Obviously, such spammy entities distort the real website analytics numbers. 

    Solution : Set Up Bot/Spam Filters 

    Google Analytics 4 has automatic filtering of bot traffic enabled for all tracked Web and App properties. 

    But if you’re using Universal Analytics, you’ll have to manually configure spam filtering. First, create a new view and then set up a custom filter. Program it to exclude :

    • Filter Field : Request URI
    • Filter Pattern : Bot traffic URL

    Once you’ve configured everything, validate the results using Verify this filter feature. Then repeat the process for other fishy URLs, hostnames and IP addresses. 

    You Don’t Filter Internal Traffic 

    Your team(s) spend a lot of time on your website — and their sporadic behaviours can impair your traffic counts and other website metrics.

    To keep your data “employee-free”, exclude traffic from : 

    • Your corporate IPs addresses 
    • Known personal IPs of employees (for remote workers) 

    If you also have a separate stage version of your website, you should also filter out all traffic coming from it. Your developers, contractors and marketing people spend a lot of time fiddling with your website. This can cause a big discrepancy in average time on page and engagement rates. 

    Solution : Set Internal Traffic Filters 

    Google provides instructions for excluding internal traffic from your reports using IPv4/IPv6 address filters. 

    Google Analytics IP filters

    Session Timeouts After 30 Minutes 

    After 30 minutes of inactivity, Google Analytics tracking sessions start over. Inactivity means no recorded interaction hits during this time. 

    Session timeouts can be a problem for some websites as users often pin a tab to check it back later. Because of this, you can count the same user twice or more — and this leads to skewed reporting. 

    Solution : Programme Custom Timeout Sessions

    You can codify custom cookie timeout sessions with the following code snippets : 

    Final Thoughts 

    Thanks to its scale and longevity, Google Analytics has some strong sides, but its data accuracy isn’t 100% perfect.

    The inability to capture analytics data from users who don’t consent to cookie tracking and data sampling applied to bigger web properties may be a deal-breaker for your business. 

    If that’s the case, try Matomo — a GDPR-compliant, accurate web analytics solution. Start your 21-day free trial now. No credit card required.