Recherche avancée

Médias (1)

Mot : - Tags -/ipad

Autres articles (111)

  • Ajouter des informations spécifiques aux utilisateurs et autres modifications de comportement liées aux auteurs

    12 avril 2011, par

    La manière la plus simple d’ajouter des informations aux auteurs est d’installer le plugin Inscription3. Il permet également de modifier certains comportements liés aux utilisateurs (référez-vous à sa documentation pour plus d’informations).
    Il est également possible d’ajouter des champs aux auteurs en installant les plugins champs extras 2 et Interface pour champs extras.

  • La sauvegarde automatique de canaux SPIP

    1er avril 2010, par

    Dans le cadre de la mise en place d’une plateforme ouverte, il est important pour les hébergeurs de pouvoir disposer de sauvegardes assez régulières pour parer à tout problème éventuel.
    Pour réaliser cette tâche on se base sur deux plugins SPIP : Saveauto qui permet une sauvegarde régulière de la base de donnée sous la forme d’un dump mysql (utilisable dans phpmyadmin) mes_fichiers_2 qui permet de réaliser une archive au format zip des données importantes du site (les documents, les éléments (...)

  • Utilisation et configuration du script

    19 janvier 2011, par

    Informations spécifiques à la distribution Debian
    Si vous utilisez cette distribution, vous devrez activer les dépôts "debian-multimedia" comme expliqué ici :
    Depuis la version 0.3.1 du script, le dépôt peut être automatiquement activé à la suite d’une question.
    Récupération du script
    Le script d’installation peut être récupéré de deux manières différentes.
    Via svn en utilisant la commande pour récupérer le code source à jour :
    svn co (...)

Sur d’autres sites (7317)

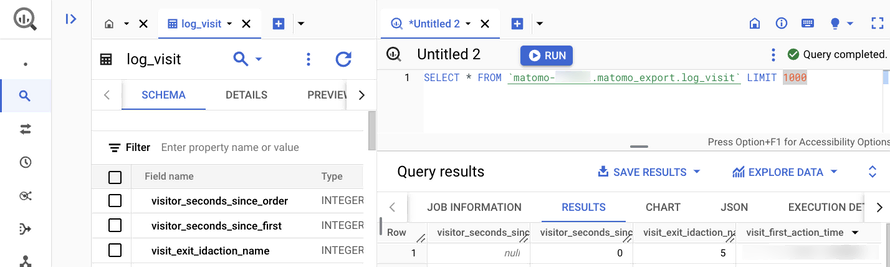
  • Introducing the Data Warehouse Connector feature

    30 janvier, par Matomo Core Team

    Matomo is built on a simple truth : your data belongs to you, and you should have complete control over it. That’s why we’re excited to launch our new Data Warehouse Connector feature for Matomo Cloud, giving you even more ways to work with your analytics data. 

    Until now, getting raw data from Matomo Cloud required APIs and custom scripts, or waiting for engineering help.  

    Our new Data Warehouse Connector feature removes those barriers. You can now access your raw, unaggregated data and schedule regular exports straight to your data warehouse. 

    The feature works with all major data warehouses including (but not limited to) : 

    • Google BigQuery 
    • Amazon Redshift 
    • Snowflake 
    • Azure Synapse Analytics 
    • Apache Hive 
    • Teradata 

    You can schedule exports, combine your Matomo data with other data sources in your data warehouse, and easily query data with SQL-like queries. 

    Direct raw data access for greater data portability 

    Waiting for engineering support can delay your work. Managing API connections and writing scripts can be time-consuming. This keeps you from focusing on what you do best—analysing data. 

    BigQuery create-table-menu

    With the Data Warehouse Connector feature, you get direct access to your raw Matomo data without the technical setup. So, you can spend more time analysing data and finding insights that matter. 

    Bringing your data together 

    Answering business questions often requires data from multiple sources. A single customer interaction might span your CRM, web analytics, sales systems, and more. Piecing this data together manually is time-consuming—what starts as a seemingly simple question from stakeholders can turn into hours of work collecting and comparing data across different tools. 

    This feature lets you combine your Matomo data with data from other business systems in your data warehouse. Instead of switching between tools or manually comparing spreadsheets, you can analyse all your data in one place to better understand how customers interact with your business. 

    Easy, custom analysis with SQL-like queries 

    Standard, pre-built reports often don’t address the specific, detailed questions that analysts need to answer.  

    When you use the Data Warehouse Connector feature, you can use SQL-like queries in your data warehouse to do detailed, customised analysis. This flexibility allows you to explore your data in depth and uncover specific insights that aren’t possible with pre-built reports. 

    Here is an example of how you might use SQL-like query to compare the behaviours of paying vs. non-paying users : 

    				
                                            <xmp>SELECT  

    custom_dimension_value AS user_type, -- Assuming 'user_type' is stored in a custom dimension

    COUNT(*) AS total_visits,  

    AVG(visit_total_time) AS avg_duration,

    SUM(conversion.revenue) AS total_spent  

    FROM  

    `your_project.your_dataset.matomo_log_visit` AS visit

    LEFT JOIN  

    `your_project.your_dataset.matomo_log_conversion` AS conversion  

    ON  

    visit.idvisit = conversion.idvisit  

    GROUP BY  

    custom_dimension_value; </xmp>
                                   

    This query helps you compare metrics such as the number of visits, average session duration, and total amount spent between paying and non-paying users. It provides a full view of behavioural differences between these groups. 

    Advanced data manipulation and visualisation 

    When you need to create detailed reports or dive deep into data analysis, working within the constraints of a fixed user interface (UI) can limit your ability to draw insights. 

    Exporting your Matomo data to a data warehouse like BigQuery provides greater flexibility for in-depth manipulation and advanced visualisations, enabling you to uncover deeper insights and tailor your reports more effectively. 

    Getting started 

    To set up data warehouse exports in your Matomo : 

    1. Go to System Admin (cog icon in the top right corner) 
    2. Select ‘Export’ from the left-hand menu 
    3. Choose ‘Data Warehouse Connector’ 

    You’ll find detailed instructions in our data warehouse exports guide 

    Please note, enabling this feature will cost an additional 10% of your current subscription. You can view the exact cost by following the steps above. 

    New to Matomo ? Start your 21-day free trial now (no credit card required), or request a demo. 

  • Matomo Launches Global Partner Programme to Deepen Local Connections and Champion Ethical Analytics

    25 juin, par Matomo Core Team — Press Releases

    Matomo introduces a global Partner Programme designed to connect organisations with trusted local experts, advancing its commitment to privacy, data sovereignty, and localisation.

    Wellington, New Zealand 25 June 2025 Matomo, the leading web analytics platform, is
    proud to announce the launch of the Matomo Partner Programme. This new initiative marks a significant step in Matomo’s global growth strategy, bringing together a carefully selected
    network of expert partners to support customers with localised, hightrust analytics services
    rooted in shared values.

    As privacy concerns rise and organisations seek alternatives to mainstream analytics solutions, the need for regional expertise has never been more vital. The Matomo Partner Programme ensures that customers around the world are supported not just by a worldclass platform, but by trusted local professionals who understand their specific regulatory, cultural, and business needs.

    “Matomo is evolving. As privacy regulations become more nuanced and the need for regional
    understanding grows, we’ve made localisation a central pillar of our strategy. Our partners are
    the key to helping customers navigate these complexities with confidence and care,” said
    Adam Taylor, Chief Operating Officer at Matomo.

    Local Experts, Global Values

    At the heart of the Matomo Partner Programme is a commitment to connect clients with local experts who live and breathe their markets. These partners are more than service
    providersthey’re trusted advisors who bring deep insight into their region’s privacy
    legislation, cultural norms, sectorspecific requirements, and digital trends.

    The programme empowers partners to act as extensions of Matomo’s core teams :

    As Customer Success allies, delivering personalised training, support, and technical
    services in local languages and time zones.
    As Sales ambassadors, raising awareness of ethical analytics in both public and private
    sectors, where trust, compliance, and transparency are crucial.

    This decentralised, valuesaligned approach ensures that every Matomo customer benefits
    from localised delivery with global consistency.

    A Programme Designed for Impactful Partnerships

    The Matomo Partner Programme is open to organisations who share a commitment to ethical, open-source analytics and can demonstrate :

    Technical excellence in deploying, configuring, and supporting Matomo Analytics in diverse environments.
    Deep market understanding, allowing them to tell the Matomo story in ways that
    resonate locally.
    Commercial strength to position Matomo across key industries, particularly in sectors with complex compliance and data sovereignty demands.

    Partners who meet these standards will be recognised as ‘Official Matomo Partners’— a symbol of excellence, credibility, and shared purpose. With this status, they gain access to :

    Brand alignment and trust : Strengthen credibility with clients by promoting their
    connection to Matomo and its globally respected ethical stance.
    Go-to-market support : Access to qualified leads, joint marketing, and tools to scale their business in a privacy-first market.
    Strategic collaboration : Early insights into the product roadmap and direct
    engagement with Matomo’s core team.
    Meaningful local impact : Help regional organisations reclaim control of their data and embrace ethical analytics with confidence.

    Ethical Analytics for Today’s World

    Matomo was founded in 2007 with the belief that people should have full control over their data. As the first opensource web analytics platform of its kind, Matomo continues to challenge the dominance of opaque, centralised tools by offering a transparent and flexible alternative that puts users first.

    In today’s landscapemarked by increased regulatory scrutiny, data protection concerns, and rapid advancements in AIMatomo’s approach is more relevant than ever. Opensource technology provides the adaptability organisations need to respond to local expectations while reinforcing digital trust with users.

    Whether it’s a government department, healthcare provider, educational institution, or
    commercial businessMatomo partners are on the ground, ready to help organisations
    transition to analytics that are not only powerful but principled.
  • How to obtain time markers for video splitting using python/OpenCV

    30 mars 2016, par Bleddyn Raw-Rees

    Hi I’m new to the world of programming and computer vision so please bare with me.

    I’m working on my MSc project which is researching automated deletion of low value content in digital file stores. I’m specifically looking at the sort of long shots that often occur in natural history filming whereby a static camera is left rolling in order to capture the rare snow leopard or whatever. These shots may only have some 60s of useful content with perhaps several hours of worthless content either side.

    As a first step I have a simple motion detection program from Adrian Rosebrock’s tutorial [http://www.pyimagesearch.com/2015/05/25/basic-motion-detection-and-tracking-with-python-and-opencv/#comment-393376]. Next I intend to use FFMPEG to split the video.

    What I would like help with is how to get in and out points based on the first and last points that motion is detected in the video.

    Here is the code should you wish to see it...

    # import the necessary packages
    import argparse
    import datetime
    import imutils
    import time
    import cv2

    # construct the argument parser and parse the arguments
    ap = argparse.ArgumentParser()
    ap.add_argument("-v", "--video", help="path to the video file")
    ap.add_argument("-a", "--min-area", type=int, default=500, help="minimum area size")
    args = vars(ap.parse_args())

    # if the video argument is None, then we are reading from webcam
    if args.get("video", None) is None:
    camera = cv2.VideoCapture(0)
    time.sleep(0.25)

    # otherwise, we are reading from a video file
    else:
       camera = cv2.VideoCapture(args["video"])

    # initialize the first frame in the video stream
    firstFrame = None

    # loop over the frames of the video
    while True:
       # grab the current frame and initialize the occupied/unoccupied
       # text
       (grabbed, frame) = camera.read()
       text = "Unoccupied"

       # if the frame could not be grabbed, then we have reached the end
       # of the video
       if not grabbed:
           break

       # resize the frame, convert it to grayscale, and blur it
       frame = imutils.resize(frame, width=500)
       gray = cv2.cvtColor(frame, cv2.COLOR_BGR2GRAY)
       gray = cv2.GaussianBlur(gray, (21, 21), 0)

       # if the first frame is None, initialize it
       if firstFrame is None:
           firstFrame = gray
           continue

       # compute the absolute difference between the current frame and
       # first frame
       frameDelta = cv2.absdiff(firstFrame, gray)
       thresh = cv2.threshold(frameDelta, 25, 255, cv2.THRESH_BINARY)[1]

       # dilate the thresholded image to fill in holes, then find contours
       # on thresholded image
       thresh = cv2.dilate(thresh, None, iterations=2)
       (_, cnts, _) = cv2.findContours(thresh.copy(), cv2.RETR_EXTERNAL, cv2.CHAIN_APPROX_SIMPLE)

       # loop over the contours
       for c in cnts:
           # if the contour is too small, ignore it
           if cv2.contourArea(c) &lt; args["min_area"]:
               continue

           # compute the bounding box for the contour, draw it on the frame,
           # and update the text
           (x, y, w, h) = cv2.boundingRect(c)
           cv2.rectangle(frame, (x, y), (x + w, y + h), (0, 255, 0), 2)
           text = "Occupied"

       # draw the text and timestamp on the frame
       cv2.putText(frame, "Room Status: {}".format(text), (10, 20),
           cv2.FONT_HERSHEY_SIMPLEX, 0.5, (0, 0, 255), 2)
       cv2.putText(frame, datetime.datetime.now().strftime("%A %d %B %Y %I:%M:%S%p"),
           (10, frame.shape[0] - 10), cv2.FONT_HERSHEY_SIMPLEX, 0.35, (0, 0, 255), 1)

       # show the frame and record if the user presses a key
       cv2.imshow("Security Feed", frame)
       cv2.imshow("Thresh", thresh)
       cv2.imshow("Frame Delta", frameDelta)
       key = cv2.waitKey(1) &amp; 0xFF

       # if the `q` key is pressed, break from the lop
       if key == ord("q"):
           break

    # cleanup the camera and close any open windows
    camera.release()
    cv2.destroyAllWindows()

    Thanks !