Recherche avancée
Médias (1)
-

Carte de Schillerkiez
13 mai 2011, par
Mis à jour : Septembre 2011
Langue : English
Type : Texte
Autres articles (53)
-
Installation en mode standalone
4 février 2011, parL’installation de la distribution MediaSPIP se fait en plusieurs étapes : la récupération des fichiers nécessaires. À ce moment là deux méthodes sont possibles : en installant l’archive ZIP contenant l’ensemble de la distribution ; via SVN en récupérant les sources de chaque modules séparément ; la préconfiguration ; l’installation définitive ;
[mediaspip_zip]Installation de l’archive ZIP de MediaSPIP
Ce mode d’installation est la méthode la plus simple afin d’installer l’ensemble de la distribution (...) -
MediaSPIP en mode privé (Intranet)
17 septembre 2013, parÀ partir de la version 0.3, un canal de MediaSPIP peut devenir privé, bloqué à toute personne non identifiée grâce au plugin "Intranet/extranet".
Le plugin Intranet/extranet, lorsqu’il est activé, permet de bloquer l’accès au canal à tout visiteur non identifié, l’empêchant d’accéder au contenu en le redirigeant systématiquement vers le formulaire d’identification.
Ce système peut être particulièrement utile pour certaines utilisations comme : Atelier de travail avec des enfants dont le contenu ne doit pas (...) -
Contribute to documentation
13 avril 2011Documentation is vital to the development of improved technical capabilities.
MediaSPIP welcomes documentation by users as well as developers - including : critique of existing features and functions articles contributed by developers, administrators, content producers and editors screenshots to illustrate the above translations of existing documentation into other languages
To contribute, register to the project users’ mailing (...)
Sur d’autres sites (7620)
-
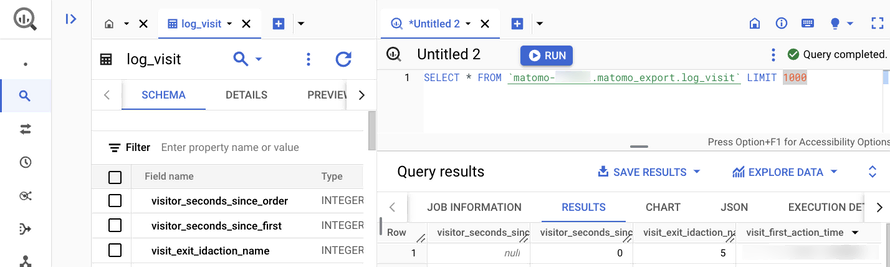
Introducing the Data Warehouse Connector feature
30 janvier, par Matomo Core Team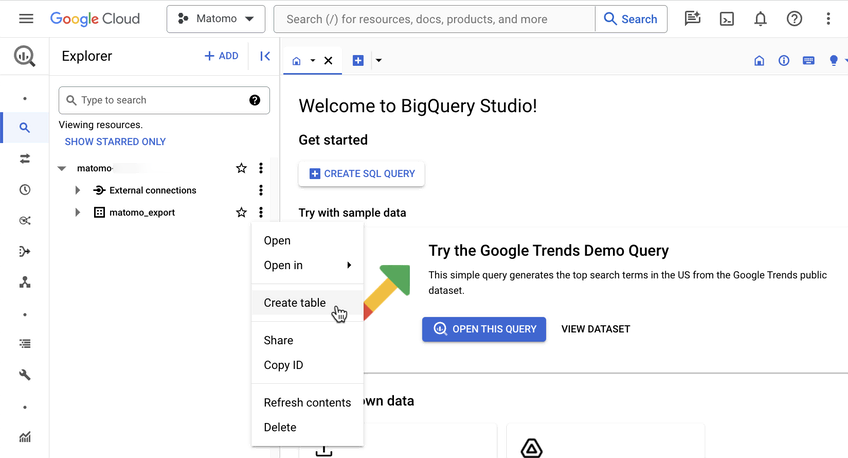
Try Matomo for Free
21 day free trial. No credit card required.
-
FFmpeg error : ratecontrol_init : can't open stats file
6 octobre 2017, par oldo.nichoI’ve setup an AWS EC2 instance running Ubuntu 14.04 and have installed FFmpeg so that I can compress and transcode video.
I’m trying to do a two pass conversion with the following code :
ffmpeg -i input-file.avi -codec:v libx264 -profile:v high -preset slow -b:v 500k -maxrate 500k -bufsize 1000k -vf scale=702:-1 -threads 0 -pass 1 -an -f mp4 ~/encoded/nulland second pass :
ffmpeg -i input-file.avi -codec:v libx264 -profile:v high -preset slow -b:v 500k -maxrate 500k -bufsize 1000k -vf scale=702:-1 -threads 0 -pass 2 -codec:a libfdk_aac -b:a 128k -f mp4 output-file.mp4However I get the following error :
ffmpeg version N-77283-g91c2a33 Copyright (c) 2000-2015 the FFmpeg developers

  built with gcc 4.8 (Ubuntu 4.8.4-2ubuntu1~14.04)

  configuration: --prefix=/home/ubuntu/ffmpeg_build --pkg-config-flags=--static --extra-cflags=-I/home/ubuntu/ffmpeg_build/include --extra-ldflags=-L/home/ubuntu/ffmpeg_build/lib --bindir=/home/ubuntu/bin --enable-gpl --enable-libass --enable-libfdk-aac --enable-libfreetype --enable-libmp3lame --enable-libopus --enable-libtheora --enable-libvorbis --enable-libx264 --enable-nonfree

  libavutil      55. 11.100 / 55. 11.100

  libavcodec     57. 17.100 / 57. 17.100

  libavformat    57. 20.100 / 57. 20.100

  libavdevice    57.  0.100 / 57.  0.100

  libavfilter     6. 21.100 /  6. 21.100

  libswscale      4.  0.100 /  4.  0.100

  libswresample   2.  0.101 /  2.  0.101

  libpostproc    54.  0.100 / 54.  0.100

Input #0, avi, from 'input-file.avi':

  Duration: 01:18:05.29, start: 0.000000, bitrate: 2025 kb/s

    Stream #0:0: Video: mpeg4 (Simple Profile) (XVID / 0x44495658), yuv420p, 720x480 [SAR 1:1 DAR 3:2], 1789 kb/s, 29.97 fps, 29.97 tbr, 29.97 tbn, 29.97 tbc

    Stream #0:1: Audio: ac3 ([0] [0][0] / 0x2000), 48000 Hz, stereo, fltp, 224 kb/s

[libx264 @ 0x1e04240] using SAR=1/1

[libx264 @ 0x1e04240] using cpu capabilities: MMX2 SSE2Fast SSSE3 SSE4.2 AVX AVX2 FMA3 LZCNT BMI2

[libx264 @ 0x1e04240] ratecontrol_init: can't open stats file

Output #0, mp4, to '/home/ubuntu/encoded/null':

    Stream #0:0: Video: h264, none, q=2-31, 128 kb/s, SAR 1:1 DAR 0:0, 29.97 fps

    Metadata:

      encoder         : Lavc57.17.100 libx264

Stream mapping:

  Stream #0:0 -> #0:0 (mpeg4 (native) -> h264 (libx264))

Error while opening encoder for output stream #0:0 - maybe incorrect parameters such as bit_rate, rate, width or height
The command as written above works fine on my local computer (running OSX). Would anyone have any suggestions as to how to fix this problem ?
-
A Guide to App Analytics Tools that Drive Growth
7 mars, par Daniel Crough — App AnalyticsMobile apps are big business, generating £438 billion in global revenue between in-app purchases (38%) and ad revenue (60%). And with 96% of apps relying on in-app monetisation, the competition is fierce.
To succeed, app developers and marketers need strong app analytics tools to understand their customers’ experiences and the effectiveness of their development efforts.
This article discusses app analytics, how it works, the importance and benefits of mobile app analytics tools, key metrics to track, and explores five of the best app analytics tools on the market.
What are app analytics tools ?
Mobile app analytics tools are software solutions that provide insights into how users interact with mobile applications. They track user behaviour, engagement and in-app events to reveal what’s working well and what needs improvement.
Insights gained from mobile app analytics help companies make more informed decisions about app development, marketing campaigns and monetisation strategies.
What do app analytics tools do ?
App analytics tools embed a piece of code, called a software development kit (SDK), into an app. These SDKs provide the essential infrastructure for the following functions :
- Data collection : The SDK collects data within your app and records user actions and events, like screen views, button clicks, and in-app purchases.
- Data filtering : SDKs often include mechanisms to filter data, ensuring that only relevant information is collected.
- Data transmission : Once collected and filtered, the SDK securely transmits the data to an analytics server. The SDK provider can host this server (like Firebase or Amplitude), or you can host it on-premise.
- Data processing and analysis : Servers capture, process and analyse large stores of data and turn it into useful information.
- Visualisation and reporting : Dashboards, charts and graphs present processed data in a user-friendly format.

Six ways mobile app analytics tools fuel marketing success and drive product growth
Mobile app analytics tools are vital in driving product development, enhancing user experiences, and achieving business objectives.
#1. Improving user understanding
The better a business understands its customers, the more likely it is to succeed. For mobile apps, that means understanding how and why people use them.
Mobile analytics tools provide detailed insights into user behaviours and preferences regarding apps. This knowledge helps marketing teams create more targeted messaging, detailed customer journey maps and improve user experiences.
It also helps product teams understand the user experience and make improvements based on those insights.
For example, ecommerce companies might discover that users in a particular area are more likely to buy certain products. This allows the company to tailor its offers and promotions to target the audience segments most likely to convert.
#2 Optimising monetisation strategies for increased revenue and user retention
In-app purchases and advertising make up 38% and 60% of mobile app revenue worldwide, respectively. App analytics tools provide insights companies need to optimise app monetisation by :
- Analysing purchase patterns to identify popular products and understand pricing sensitivities.
- Tracking in-app behaviour to identify opportunities for enhancing user engagement.
App analytics can track key metrics like visit duration, user flow, and engagement patterns. These metrics provide critical information about user experiences and can help identify areas for improvement.
How meaningful are the impacts ?
Duolingo, the popular language learning app, reported revenue growth of 45% and an increase in daily active users (DAU) of 65% in its Q4 2023 financial report. The company attributed this success to its in-house app analytics platform.

#3. Understanding user experiences
Mobile app analytics tools track the performance of user interactions within your app, such as :
- Screen views : Which screens users visit most frequently
- User flow : How users navigate through your app
- Session duration : How long users spend in your app
- Interaction events : Which buttons, features, and functions users engage with most
Knowing how users interact with your app can help refine your approach, optimise your efforts, and drive more conversions.
#4. Personalising user experiences
A recent McKinsey survey showed that 71% of users expect personalised app experiences. Product managers must stay on top of this since 76% of users get frustrated if they don’t receive the personalisation they expect.
Personalisation on mobile platforms requires data capture and analysis. Mobile analytics platforms can provide the data to personalise the user onboarding process, deliver targeted messages and recommend relevant content or offers.
Spotify is a prime example of personalisation done right. A recent case study by Pragmatic Institute attributed the company’s growth to over 500 million active daily users to its ability to capture, analyse and act on :
- Search behaviour
- Individual music preferences
- Playlist data
- Device usage
- Geographical location
The streaming service uses its mobile app analytics software to turn this data into personalised music recommendations for its users. Spotify also has an in-house analytics tool called Spotify Premium Analytics, which helps artists and creators better understand their audience.
#5. Enhancing app performance
App analytics tools can help identify performance issues that might be affecting user experience. By monitoring metrics like load time and app performance, developers can pinpoint areas that need improvement.
Performance optimisation is crucial for user retention. According to Google research, 53% of mobile site visits are abandoned if pages take longer than three seconds to load. While this statistic refers to websites, similar principles apply to apps—users expect fast, responsive experiences.
Analytics data can help developers prioritise performance improvements by showing which screens or features users interact with most frequently, allowing teams to focus their optimisation efforts where they’ll have the greatest impact.
#6. Identifying growth opportunities
App analytics tools can reveal untapped opportunities for growth by highlighting :
- Features users engage with most
- Underutilised app sections that might benefit from redesign
- Common user paths that could be optimised
- Moments where users tend to drop off
This intelligence helps product teams make data-informed decisions about future development priorities, feature enhancements, and potential new offerings.
For example, a streaming service might discover through analytics that users who create playlists have significantly higher retention rates. This insight could lead to development of enhanced playlist functionality to encourage more users to create them, ultimately boosting overall retention.
Key app metrics to track
Using mobile analytics tools, you can track dozens of key performance indicators (KPIs) that measure everything from customer engagement to app performance. This section focuses on the most important KPIs for app analytics, classified into three categories :
- App performance KPIs
- User engagement KPIs
- Business impact KPIs
While the exact metrics to track will vary based on your specific goals, these fundamental KPIs form the foundation of effective app analytics.

App performance KPIs
App performance metrics tell you whether an app is reliable and operating properly. They help product managers identify and address technical issues that may negatively impact user experiences.
Some key metrics to assess performance include :
- Screen load time : How quickly screens load within your app
- App stability : How often your app crashes or experiences errors
- Response time : How quickly your app responds to user interactions
- Network performance : How efficiently your app handles data transfers
User engagement KPIs
Engagement KPIs provide insights into how users interact with an app. These metrics help you understand user behaviour and make UX improvements.
Important engagement metrics include :
- Returning visitors : A measure of how often users return to an app
- Visit duration : How long users spend in your app per session
- User flow : Visualisation of the paths users take through your app, offering insights into navigation patterns
- Event tracking : Specific interactions users have with app elements
- Screen views : Which screens are viewed most frequently
Business impact KPIs
Business impact KPIs connect app analytics to business outcomes, helping demonstrate the app’s value to the organisation.
Key business impact metrics include :
- Conversion events : Completion of desired actions within your app
- Goal completions : Tracking when users complete specific objectives
- In-app purchases : Monitoring revenue from within the app
- Return on investment : Measuring the business value generated relative to development costs
Privacy and app analytics : A delicate balance
While app analytics tools can be a rich source of user data, they must be used responsibly. Tracking user in-app behaviour and collecting user data, especially without consent, can raise privacy concerns and erode user trust. It can also violate data privacy laws like the GDPR in Europe or the OCPA, FDBR and TDPSA in the US.
With that in mind, it’s wise to choose user-tracking tools that prioritise user privacy while still collecting enough data for reliable analysis.
Matomo is a privacy-focused web and app analytics solution that allows you to collect and analyse user data while respecting user privacy and following data protection rules like GDPR.
The five best app analytics tools to prove marketing value
In this section, we’ll review the five best app analytics tools based on their features, pricing and suitability for different use cases.
Matomo — Best for privacy-compliant app analytics
Matomo app analytics is a powerful, open-source platform that prioritises data privacy and compliance.

It offers a suite of features for tracking user engagement and conversions across websites, mobile apps and intranets.
Key features
- Complete data ownership : Full control over your analytics data with no third-party access
- User flow analysis : Track user journeys across different screens in your app
- Custom event tracking : Monitor specific user interactions with customisable events
- Ecommerce tracking : Measure purchases and product interactions
- Goal conversion monitoring : Track completion of important user actions
- Unified analytics : View web and app analytics in one platform for a complete digital picture
Benefits
- Eliminate compliance risks without sacrificing insights
- Get accurate data with no sampling or data manipulation
- Choose between self-hosting or cloud deployment
- Deploy one analytics solution across your digital properties (web and app) for a single source of truth
Pricing
Plan Price Cloud Starts at £19/month On-Premise Free Matomo is a smart choice for businesses that value data privacy and want complete control over their analytics data. It’s particularly well-suited for organisations in highly regulated industries, like banking.
While Matomo’s app analytics features focus on core analytics capabilities, its privacy-first approach offers unique advantages. For organisations already using Matomo for web analytics, extending to mobile creates a unified analytics ecosystem with consistent privacy standards across all digital touchpoints, giving organisations a complete picture of the customer journey.
Firebase — Best for Google services integration
Firebase is the mobile app version of Google Analytics. It’s the most popular app analytics tool on the market, with over 99% of Android apps and 77% of iOS apps using Firebase.
Firebase is popular because it works well with other Google services. It also has many features, like crash reporting, A/B testing and user segmentation.
Pricing
Plan Price Spark Free Blaze Pay-as-you-go based on usage Custom Bespoke pricing for high-volume enterprise users Adobe Analytics — Best for enterprise app analytics
Adobe Analytics is an enterprise-grade analytics solution that provides valuable insights into user behaviour and app performance.
It’s part of the Adobe Marketing Cloud and integrates easily with other Adobe products. Adobe Analytics is particularly well-suited for large organisations with complex analytics needs.
Pricing
Plan Price Select Pricing on quote Prime Pricing on quote Ultimate Pricing on quote While you must request a quote for pricing, Scandiweb puts Adobe Analytics at £2,000/mo–£2,500/mo for most companies, making it an expensive option.
Apple App Analytics — Best for iOS app analysis
Apple App Analytics is a free, built-in analytics tool for iOS app developers.
This analytics platform provides basic insights into user engagement, app performance and marketing campaigns. It has fewer features than other tools on this list, but it’s a good place for iOS developers who want to learn how their apps work.
Pricing
Apple Analytics is free.
Amplitude — Best for product analytics
Amplitude is a product analytics platform that helps businesses understand user behaviour and build better products.
It excels at tracking user journeys, identifying user segments and measuring the impact of product changes. Amplitude is a good choice for product managers and data analysts who want to make informed decisions about product development.
Pricing
Plan Price Starter Free Plus From £49/mo Growth Pricing on quote Choose Matomo’s app analytics to unlock growth
App analytics tools help marketers and product development teams understand user experiences, improve app performance and enhance products. Some of the best app analytics tools available for 2025 include Matomo, Firebase and Amplitude.
However, as you evaluate your options, consider taking a privacy-first approach to app data collection and analysis, especially if you’re in a highly regulated industry like banking or fintech. Matomo Analytics offers a powerful and ethical solution that allows you to gain valuable insights while respecting user privacy.
Ready to take control of your app analytics ? Start your 21-day free trial.


