Recherche avancée

Médias (0)

Mot : - Tags -/gis

Aucun média correspondant à vos critères n’est disponible sur le site.

Autres articles (52)

  • Modifier la date de publication

    21 juin 2013, par

    Comment changer la date de publication d’un média ?
    Il faut au préalable rajouter un champ "Date de publication" dans le masque de formulaire adéquat :
    Administrer > Configuration des masques de formulaires > Sélectionner "Un média"
    Dans la rubrique "Champs à ajouter, cocher "Date de publication "
    Cliquer en bas de la page sur Enregistrer

  • Publier sur MédiaSpip

    13 juin 2013

    Puis-je poster des contenus à partir d’une tablette Ipad ?
    Oui, si votre Médiaspip installé est à la version 0.2 ou supérieure. Contacter au besoin l’administrateur de votre MédiaSpip pour le savoir

  • Contribute to documentation

    13 avril 2011

    Documentation is vital to the development of improved technical capabilities.
    MediaSPIP welcomes documentation by users as well as developers - including : critique of existing features and functions articles contributed by developers, administrators, content producers and editors screenshots to illustrate the above translations of existing documentation into other languages
    To contribute, register to the project users’ mailing (...)

Sur d’autres sites (7466)

  • Web Analytics Reports : 10 Key Types and How to Use Them

    29 janvier 2024, par Erin

    You can’t optimise your website to drive better results if you don’t know how visitors are engaging with your site.

    But how do you correctly analyse data and identify patterns ? With the right platform, you can use a wide range of web analytics reports to dive deep into the data.

    In this article, we’ll discuss what website analytics reports are, different types, why you need them, and how to use reports to find the insights you need.

    What is web analytics ?

    Website analytics is the process of gathering, processing, and analysing data that shows what users are doing when they visit your website. 

    You typically achieve this with web analytics tools by adding a tracking code that shares data with the analytics platform when someone visits the site.

    Illustration of how website analytics works

    The visitors trigger the tracking code, which collects data on how they act while on your site and then sends that information to the analytics platform. You can then see the data in your analytics solution and create reports based on this data.

    While there are a lot of web analytics solutions available, this article will specifically demonstrate reports using Matomo.

    What are web analytics reports ?

    Web analytics reports are analyses that focus on specific data points within your analytics platform. 

    For example, this channel report in Matomo shows the top referring channels of a website.

    Channel types report in Matomo analytics

    Your marketing team can use this report to determine which channels drive the best results. In the example above, organic search drives almost double the visits and actions of social campaigns. 

    If you’re investing the same amount of money, you’d want to move more of your budget from social to search.

    Why you need to get familiar with specific web analytics reports

    The default web analytics dashboard offers an overview of high-level trends in performance. However, it usually does not give you specific insights that can help you optimise your marketing campaigns.

    For example, you can see that your conversions are down month over month. But, at a glance, you do not understand why that is.

    To understand why, you need to go granular and wider — looking into qualifying data that separates different types of visitors from each other.

    Gartner predicts that 70% of organisations will focus on “small and wide” data by 2025 over “big data.” Most companies lack the data volume to simply let big data and algorithms handle the optimising.

    What you can do instead is dive deep into each visitor. Figure out how they engage with your site, and then you can adjust your campaigns and page content accordingly.

    Common types of web analytics reports

    There are dozens of different web analytics reports, but they usually fall into four separate categories :

    Diagram that illustrates the main types of web analytics reports
    • Referral sources : These reports show where your visitors come from. They range from channel reports — search, social media — to specific campaigns and ads.
    • Engagement (on-site actions) : These reports dive into what visitors are doing on your site. They break down clicks, scrolling, completed conversion goals, and more.
    • E-commerce performance : These reports show the performance of your e-commerce store. They’ll help you dive into the sales of individual products, trends in cart abandonment and more.
    • Demographics : These reports help you understand more about your visitors — where they’re visiting from, their browser language, device, and more.

    You can even combine insights across all four using audience segmentation and custom reports. (We’ll cover this in more detail later.)

    How to use 10 important website analytics reports

    The first step is to install the website analytics code on your website. (We include more detailed information in our guide on how to track website visitors.)

    Then, you need to wait until you have a few days (or, if you have limited traffic, a few weeks) of data. Without sufficient website visitor data, none of the reports will be meaningful.

    Visitor Overview report

    First, let’s take a look at the Visitor Overview report. It’s a general report that breaks down the visits over a given time period.

    Visitor overview report in Matomo

    What this report shows :

    • Trends in unique visits month over month
    • Basic engagement trends like the average visit length and bounce rate
    • The number of actions taken per page

    In general, this report is more of a high-level indicator you can use to explore certain areas more thoroughly. For example, if most of your traffic comes from organic traffic or social media, you can dive deeper into those channels.

    Try Matomo for Free

    Get the web insights you need, without compromising data accuracy.

    No credit card required

    Location report

    Next up, we have the most basic type of demographic report — the Location report. It shows where your visitors tend to access your website from.

    Location report in Matomo

    What this report shows :

    • The country, state or city your visitors access your website from

    This report is most useful for identifying regional trends. You may notice that your site is growing in popularity in a country. You can take advantage of this by creating a regional campaign to double down on a high performing audience.

    Device report

    Next, we have the Device report, which breaks down your visitors’ devices.

    Device report in Matomo analytics

    What this report shows :

    • Overall device types used by your visitors
    • Specific device models used

    Today, most websites are responsive or use mobile-first design. So, just seeing that many people access your site through smartphones probably isn’t all that surprising.

    But you should ensure your responsive design doesn’t break down on popular devices. The design may not work effectively because many phones have different screen resolutions. 

    Users Flow report

    The Users Flow report dives deeper into visitor engagement — how your visitors act on your site. It shows common landing pages — the first page visitors land on — and how they usually navigate your site from there.

    Users flow report in Matomo analytics

    What this report shows :

    • Popular landing pages
    • How your visitors most commonly navigate your site

    You can use this report to determine which intermediary pages are crucial to keeping visitors engaged. For example, you can prioritise optimisation and rewriting for case study pages that don’t get a lot of direct search or campaign traffic.

    Improving this flow can improve conversion rates and the impact of your marketing efforts.

    Try Matomo for Free

    Get the web insights you need, without compromising data accuracy.

    No credit card required

    Exit Pages report

    The Exit Pages report complements the Users Flow report well. It highlights the most common pages visitors leave your website from.

    Exit pages report in Matomo analytics

    What this report shows :

    • The most common exit pages on your website
    • The exit rates of these pages

    Pages with high exit rates fall into two categories. The first are pages where it makes sense that visitors leave, like a post-purchase thank-you page. The second are pages where you’d want your visitors to stay and keep flowing down the funnel. When the rates are unusually high on product pages, category pages, or case study pages, you may have found a problem.

    By combining insights from the Users Flow and Exit Pages reports, you can find valuable candidates for optimisation. This is a key aspect of effective conversion rate optimisation.

    Traffic Acquisition Channel report

    The Acquisition Channels report highlights the channels that drive the most visitors to your site.

    Acquisition report in Matomo analytics

    What this report shows :

    • Top referring traffic sources by channel type
    • The average time on site, bounce rates, and actions taken by the source

    Because of increasingly privacy-sensitive browsers and apps, the best way to reliably track traffic sources is to use campaign tracking URL. Matomo offers an easy-to-use campaign tracking URL builder to simplify this process.

    Search Engines and Keywords report

    The Search Engines and Keywords report shows which keywords are driving the most organic search traffic and from what search engines.

    Search engine keyword report in Matomo analytics

    What this report shows :

    • Search engine keywords that drive traffic
    • The different search engines that refer visitors

    One of the best ways to use this report is to identify low-hanging fruit. You want to find keywords driving some traffic where your page isn’t ranked in the top three results. If the keyword has high traffic potential, you should then work to optimise that page to rank higher and get more traffic. This technique is an efficient way to improve your SEO performance.

    Ecommerce Products report

    If you sell products directly on your website, the Ecommerce Products report is a lifesaver. It shows you exactly how all your products are performing.

    Ecommerce product report in Matomo analytics

    What this report shows :

    • How your products are selling
    • The average sale price (with coupons) and quantity

    This report could help an online retailer identify top-selling items, adjust pricing based on average sale prices, and strategically allocate resources to promote or restock high-performing products for maximum profitability.

    Try Matomo for Free

    Get the web insights you need, without compromising data accuracy.

    No credit card required

    Ecommerce Log report

    If you want to explore every single ecommerce interaction, the Ecommerce Log report is for you. It breaks down the actions of visitors who add products to their cart in real time.

    Ecommerce log report in Matomo analytics

    What this report shows :

    • The full journey of completed purchases and abandoned carts
    • The exact actions your potential customers take and how long their journeys last

    If you suspect that the user experience of your online store isn’t perfect, this report helps you confirm or deny that suspicion. By closely examining individual interactions, you can identify common exit pages or other issues.

  • A *hot* Piwik Community Meetup 2015 !

    10 août 2015 — Community

    Last weekend I arrived in Germany to attend the Piwik Community Meetup 2015 and now I am in Poland. I joined Piwik PRO back in May as enterprise support project coordinator in North America. I am now writing this from the Piwik PRO main office in Wrocław, where I’ll be working from for the next two weeks.

    The meetup was HOT in every sense ! Berlin temperatures reached 35 degrees (celsius), as I finally meet in person several long-time, dedicated Piwik community contributors.

    Meetup preparation in Berlin, photo by M. Zawadziński, licensed under CC-BY-SA 4.0

    Pictures from the meetup preparation sessions

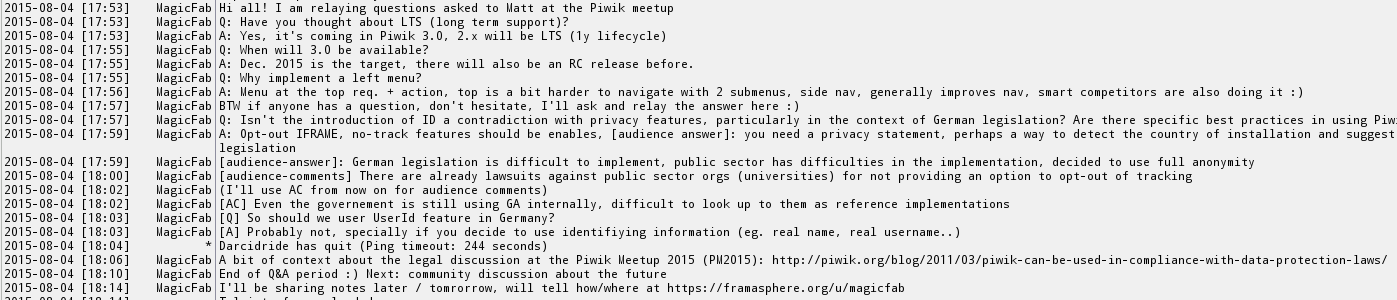
    In the first leg of my trip I was in Berlin to meet Piwik community members and Piwik PRO staff to prepare for the 2015 annual Piwik community meetup. These are my notes taken during the meeting at the request of one of my colleagues. I also relayed live on Framasphère, Twitter and IRC.

    Community discussion at the meetup, photo by D.Czajka, licensed under CC-BY-SA 4.0

    More pictures from the Piwik meetup

    This was harder than I expected, as I took notes with my laptop, pictures with my phone, wrote live to social media (using the Android Diaspora Native Web App), and used my laptop to relay on IRC. Going forward this requires better preparation, I was glad I had a few links and pictures ready before hand but it really requires intense focus to achieve this. I am glad presenters were patient when I requested repeating some of the ideas they shared. I am also a bit disappointed not much happened in IRC.

    Two day preparation sessions

    The discussions and session we had during the two days prior to the meetup are available here.

    We gathered in rented apartments in Berlin, this reminded me very much of similar community gatherings and perhaps of BarCamp and, at a much smaller scale, UDS sessions.

    Piwik Pizza !, photo by F. Rodríguez, licensed under CC-BY-SA 4.0

    A list of ideas of topics was initially submitted, we then proceeded to have scheduled sessions for open discussion. Several people shared their concern there was no possible remote participation which led to making public the Trello boards used/linked here.

    Note : The Trello links below still have action items and notes that are pending bug report / feature requests filing which should happen over the coming weeks. Most importantly, many action items will need identifying leads for different community team including Translations and Documentation, and better coordination of coming community engagement.

    Monday sessions consisted of the following subjects :

    On Tuesday we met again to discuss the following subjects :

    Some more details about individual preparation sessions

    What are Piwik values & how to communicate them ?

    The main subjects in this session were important changes proposed in the project mission and values. This was edited directly on on the wiki page on GitHub, some of the changes can be seen by comparing revisions.

    Piwik mission statement (bug #7376)

    “To create the leading Free and open source analytics platform, and to support global organisations and communities to keep full control over their data.”

    Our values

    • Openness
    • Freedom
    • Transparency
    • Data ownership
    • Privacy
    • Kaizen (改善) : continuous improvement

    This was also presented by Matthieu Aubry at the meetup and is published in the Roadmap page. Bringing more visibility and perhaps having a top page for Mission and Values was also brought up.

    Meetup agenda and notes

    The official agenda is available here.

    Many Piwik PRO employees stayed in Berlin for the meetup, and we had good participation although less than last year in Munich as my colleagues told me. Some were consultants, others staff from public organizations, universities, etc. In retrospect considering the very hot weather and summer holidays the attendance was good. I was very happy to arrive at the beautiful Kulturbrauerei and enter the air-conditioned Soda Club. T-Shirts were waiting for all attendees and free drinks (non-alcohol !) were welcome

  • GDPR Compliance and Personal Data : The Ultimate Guide

    22 septembre 2023, par Erin — GDPR

    According to the International Data Corporation (IDC), the world generated 109 zettabytes of data in 2022 alone, and that number is on track to nearly triple to 291 zettabytes in 2027. For scale, that’s one trillion gigs or one followed by 21 zeros in bytes.

    A major portion of that data is generated online, and the conditions for securing that digital data can have major real-world consequences. For example, online identifiers that fall into the wrong hands can be used nefariously for cybercrime, identity theft or unwanted targeting. Users also want control over how their actions are tracked online and transparency into how their information is used.

    Therefore, regional and international regulations are necessary to set the terms for respecting users’ privacy and control over personal information. Perhaps the most widely known of these laws is the European Union’s General Data Protection Regulation (GDPR).

    What is personal data under GDPR ?

    Under the General Data Protection Regulation (GDPR), “personal data” refers to information linked to an identifiable natural person. An “identifiable natural person” is someone directly or indirectly recognisable via individually specific descriptors such as physical, genetic, economic, cultural, employment and social details.

    It’s important to note that under GDPR, the definition of personal data is very broad, and it encompasses both information that is commonly considered personal (e.g., names and addresses) and more technical or specialised data (e.g., IP addresses or device IDs) that can be used to identify individuals indirectly.

    Organisations that handle personal data must adhere to strict rules and principles regarding the processing and protection of this data to ensure individuals’ privacy rights are respected and upheld.

    Personal data can include, but is not limited to, the following :

    1. Basic Identity Information : This includes a person’s name, government-issued ID number, social address, phone number, email address or other similar identifiers.
    2. Biographical Information : Details such as date of birth, place of birth, nationality and gender.
    3. Contact Information : Information that allows communication with the individual, such as phone numbers, email addresses or mailing addresses.
    4. Financial Information : Data related to a person’s finances, including credit card numbers, bank account numbers, income records or financial transactions.
    5. Health and Medical Information : Information about a person’s health, medical history or healthcare treatments.
    6. Location Data : Data that can pinpoint a person’s geographical location, such as GPS coordinates or information derived from mobile devices.
    7. Online Identifiers : Information like IP addresses, cookies or other online tracking mechanisms that can be used to identify or track individuals online.
    8. Biometric Data : Unique physical or behavioural characteristics used for identification, such as fingerprints, facial recognition data or voiceprints.

    Sensitive Data

    Sensitive data is a special category of personal data prohibited from processing unless specific conditions are met, including users giving explicit consent. The data must also be necessary to fulfil one or more of a limited set of allowed purposes, such as reasons related to employment, social protections or legal claims.

    Sensitive information includes details about a person’s racial or ethnic origin, sexual orientation, political opinions, religion, trade union membership, biometric data or genetic data.

    What are the 7 main principles of GDPR ?

    The 7 principles of GDPR guide companies in how to properly handle personal data gathered from their users.

    A list of the main principles to follow for GDPR personal data handling

    The seven principles of GDPR are :

    1. Lawfulness, fairness and transparency

    Lawfulness means having legal grounds for data processing, such as consent, legitimate interests, contract and legal obligation. If you can achieve your objective without processing personal data, the basis is no longer lawful.

    Fairness means you’re processing data reasonably and in line with users’ best interests, and they wouldn’t be shocked if they find out what you’re using it for.

    Transparency means being open regarding when you’re processing user data, what you’re using it for and who you’re collecting it from.

    To get started with this, use our guide on creating a GDPR-compliant privacy policy.

    2. Purpose limitation

    You should only process user data for the original purposes you communicated to users when requesting their explicit consent. If you aim to undertake a new purpose, it must be compatible with the original stated purpose. Otherwise, you’ll need to ask for consent again.

    3. Data minimisation

    You should only collect as much data as you need to accomplish compliant objectives and nothing more, especially not other personally identifiable information (PII).

    Matomo provides several features for extensive data minimisation, including the ability to anonymize IP addresses.

    Data minimisation is well-liked by users. Around 70% of people have taken active steps towards protecting their identity online, so they’ll likely appreciate any principles that help them in this effort.

    4. Accuracy

    The user data you process should be accurate and up-to-date where necessary. You should have reasonable systems to catch inaccurate data and correct or delete it. If there are mistakes that you need to store, then you need to label them clearly as mistakes to keep them from being processed as accurate.

    5. Storage limitation

    This principle requires you to eliminate data you’re no longer using for the original purposes. You must implement time limits, after which you’ll delete or anonymize any user data on record. Matomo allows you to configure your system such that logs are automatically deleted after some time.

    6. Integrity and confidentiality

    This requires that data processors have security measures in place to protect data from threats such as hackers, loss and damage. As an open-source web analytics solution, Matomo enables you to verify its security first-hand.

    7. Accountability

    Accountability means you’re responsible for what you do with the data you collect. It’s your duty to maintain compliance and document everything for audits. Matomo tracks a lot of the data you’d need for this, including activity, task and application logs.

    Who does GDPR apply to ?

    The GDPR applies to any company that processes the personal data of EU citizens and residents (regardless of the location of the company). 

    If this is the first time you’ve heard about this, don’t worry ! Matomo provides tools that allow you to determine exactly what kinds of data you’re collecting and how they must be handled for full compliance. 

    Best practices for processing personal data under GDPR

    Companies subject to the GDPR need to be aware of several key principles and best practices to ensure they process personal data in a lawful and responsible manner.

    Here are some essential practices to implement :

    1. Lawful basis for processing : Organisations must have a lawful basis for processing personal data. Common lawful bases include the necessity of processing for compliance with a legal obligation, the performance of a contract, the protection of vital interests and tasks carried out in the public interest. Your organisation’s legitimate interests for processing must not override the individual’s legal rights. 
    2. Data minimisation : Collect and process only the personal data that is necessary for the specific purpose for which it was collected. Matomo’s anonymisation capabilities help you avoid collecting excessive or irrelevant data.
    3. Transparency : Provide clear and concise information to individuals about how their data will be processed. Privacy statements should be clear and accessible to users to allow them to easily understand how their data is used.
    4. Consent : If you are relying on consent as a lawful basis, make sure you design your privacy statements and consent forms to be usable. This lets you ensure that consent is freely given, specific, informed and unambiguous. Also, individuals must be able to withdraw their consent at any time.
    5. Data subject rights : You must have mechanisms in place to uphold the data subject’s individual rights, such as the rights to access, erase, rectify errors and restrict processing. Establish internal processes for handling such requests.
    6. Data protection impact assessments (DPIAs) : Conduct DPIAs for high-risk processing activities, especially when introducing new technologies or processing sensitive data.
    7. Security measures : You must implement appropriate technical security measures to maintain the safety of personal data. This can include ‌security tools such as encryption, firewalls and limited access controls, as well as organisational practices like regular security assessments. 
    8. Data breach response : Develop and maintain a data breach response plan. Notify relevant authorities and affected individuals of data breaches within the required timeframe.
    9. International data transfers : If transferring personal data outside the EU, ensure that appropriate safeguards are in place and consider GDPR provisions. These provisions allow data transfers from the EU to non-EU countries in three main ways :
      1. When the destination country has been deemed by the European Commission to have adequate data protection, making it similar to transferring data within the EU.
      2. Through the use of safeguards like binding corporate rules, approved contractual clauses or adherence to codes of conduct.
      3. In specific situations when none of the above apply, such as when an individual explicitly consents to the transfer after being informed of the associated risks.
    10. Data protection officers (DPOs) : Appoint a data protection officer if required by GDPR. DPOs are responsible for overseeing data protection compliance within the organisation.
    11. Privacy by design and default : Integrate data protection into the design of systems and processes. Default settings should prioritise user privacy, as is the case with something like Matomo’s first-party cookies.
    12. Documentation : Maintain records of data processing activities, including data protection policies, procedures and agreements. Matomo logs and backs up web server access, activity and more, providing a solid audit trail.
    13. Employee training : Employees who handle personal data must be properly trained to uphold data protection principles and GDPR compliance best practices. 
    14. Third-party contracts : If sharing data with third parties, have data processing agreements in place that outline the responsibilities and obligations of each party regarding data protection.
    15. Regular audits and assessments : Conduct periodic audits and assessments of data processing activities to ensure ongoing compliance. As mentioned previously, Matomo tracks and saves several key statistics and metrics that you’d need for a successful audit.
    16. Accountability : Demonstrate accountability by documenting and regularly reviewing compliance efforts. Be prepared to provide evidence of compliance to data protection authorities.
    17. Data protection impact on data analytics and marketing : Understand how GDPR impacts data analytics and marketing activities, including obtaining valid consent for marketing communications.

    Organisations should be on the lookout for GDPR updates, as the regulations may evolve over time. When in doubt, consult legal and privacy professionals to ensure compliance, as non-compliance could potentially result in significant fines, damage to reputation and legal consequences.

    What constitutes a GDPR breach ?

    Security incidents that compromise the confidentiality, integrity and/or availability of personal data are considered a breach under GDPR. This means a breach is not limited to leaks ; if you accidentally lose or delete personal data, its availability is compromised, which is technically considered a breach.

    What are the penalty fines for GDPR non-compliance ?

    The penalty fines for GDPR non-compliance are up to €20 million or up to 4% of the company’s revenue from the previous fiscal year, whichever is higher. This makes it so that small companies can also get fined, no matter how low-profile the breach is.

    In 2022, for instance, a company found to have mishandled user data was fined €2,000, and the webmaster responsible was personally fined €150.

    Is Matomo GDPR compliant ?

    Matomo is fully GDPR compliant and can ensure you achieve compliance, too. Here’s how :

    • Data anonymization and IP anonymization
    • GDPR Manager that helps you identify gaps in your compliance and address them effectively
    • Users can opt-out of all tracking
    • First-party cookies by default
    • Users can view the data collected
    • Capabilities to delete visitor data when requested
    • You own your data and it is not used for any other purposes (like advertising)
    • Visitor logs and profiles can be disabled
    • Data is stored in the EU (Matomo Cloud) or in any country of your choice (Matomo On-Premise)

    Is there a GDPR in the US ?

    There is no GDPR-equivalent law that covers the US as a whole. That said, US-based companies processing data from persons in the EU still need to adhere to GDPR principles.

    While there isn’t a federal data protection law, several states have enacted their own. One notable example is the California Consumer Privacy Act (CCPA), which Matomo is fully compliant with.

    Ready for GDPR-compliant analytics ?

    The GDPR lays out a set of regulations and penalties that govern the collection and processing of personal data from EU citizens and residents. A breach under GDPR attracts a fine of either up to €20 million or 4% of the company’s revenue, and the penalty applies to companies of all sizes.

    Matomo is fully GDPR compliant and provides several features and advanced privacy settings to ensure you ‌are as well, without sacrificing the resources you need for effective analytics. If you’re ready to get started, sign up for a 21-day free trial of Matomo — no credit card required.

    Disclaimer
    We are not lawyers and don’t claim to be. The information provided here is to help give an introduction to GDPR. We encourage every business and website to take data privacy seriously and discuss these issues with your lawyer if you have any concerns.