Recherche avancée
Médias (1)
-

Video d’abeille en portrait
14 mai 2011, par
Mis à jour : Février 2012
Langue : français
Type : Video
Autres articles (111)
-
Participer à sa traduction
10 avril 2011Vous pouvez nous aider à améliorer les locutions utilisées dans le logiciel ou à traduire celui-ci dans n’importe qu’elle nouvelle langue permettant sa diffusion à de nouvelles communautés linguistiques.
Pour ce faire, on utilise l’interface de traduction de SPIP où l’ensemble des modules de langue de MediaSPIP sont à disposition. ll vous suffit de vous inscrire sur la liste de discussion des traducteurs pour demander plus d’informations.
Actuellement MediaSPIP n’est disponible qu’en français et (...) -
Les formats acceptés
28 janvier 2010, parLes commandes suivantes permettent d’avoir des informations sur les formats et codecs gérés par l’installation local de ffmpeg :
ffmpeg -codecs ffmpeg -formats
Les format videos acceptés en entrée
Cette liste est non exhaustive, elle met en exergue les principaux formats utilisés : h264 : H.264 / AVC / MPEG-4 AVC / MPEG-4 part 10 m4v : raw MPEG-4 video format flv : Flash Video (FLV) / Sorenson Spark / Sorenson H.263 Theora wmv :
Les formats vidéos de sortie possibles
Dans un premier temps on (...) -
Ajouter notes et légendes aux images
7 février 2011, parPour pouvoir ajouter notes et légendes aux images, la première étape est d’installer le plugin "Légendes".
Une fois le plugin activé, vous pouvez le configurer dans l’espace de configuration afin de modifier les droits de création / modification et de suppression des notes. Par défaut seuls les administrateurs du site peuvent ajouter des notes aux images.
Modification lors de l’ajout d’un média
Lors de l’ajout d’un média de type "image" un nouveau bouton apparait au dessus de la prévisualisation (...)
Sur d’autres sites (9140)
-
Saying Goodbye To Old Machines
I recently sent a few old machines off for recycling. Both had relevance to the early days of the FATE testing effort. As is my custom, I photographed them (poorly, of course).
First, there’s the PowerPC-based Mac Mini I procured thanks to a Craigslist ad in late 2006. I had plans to develop automated FFmpeg building and testing and was already looking ahead toward testing multiple CPU architectures. Again, this was 2006 and PowerPC wasn’t completely on the outs yet– although Apple’s MacTel transition was in full swing, the entire new generation of video game consoles was based on PowerPC.

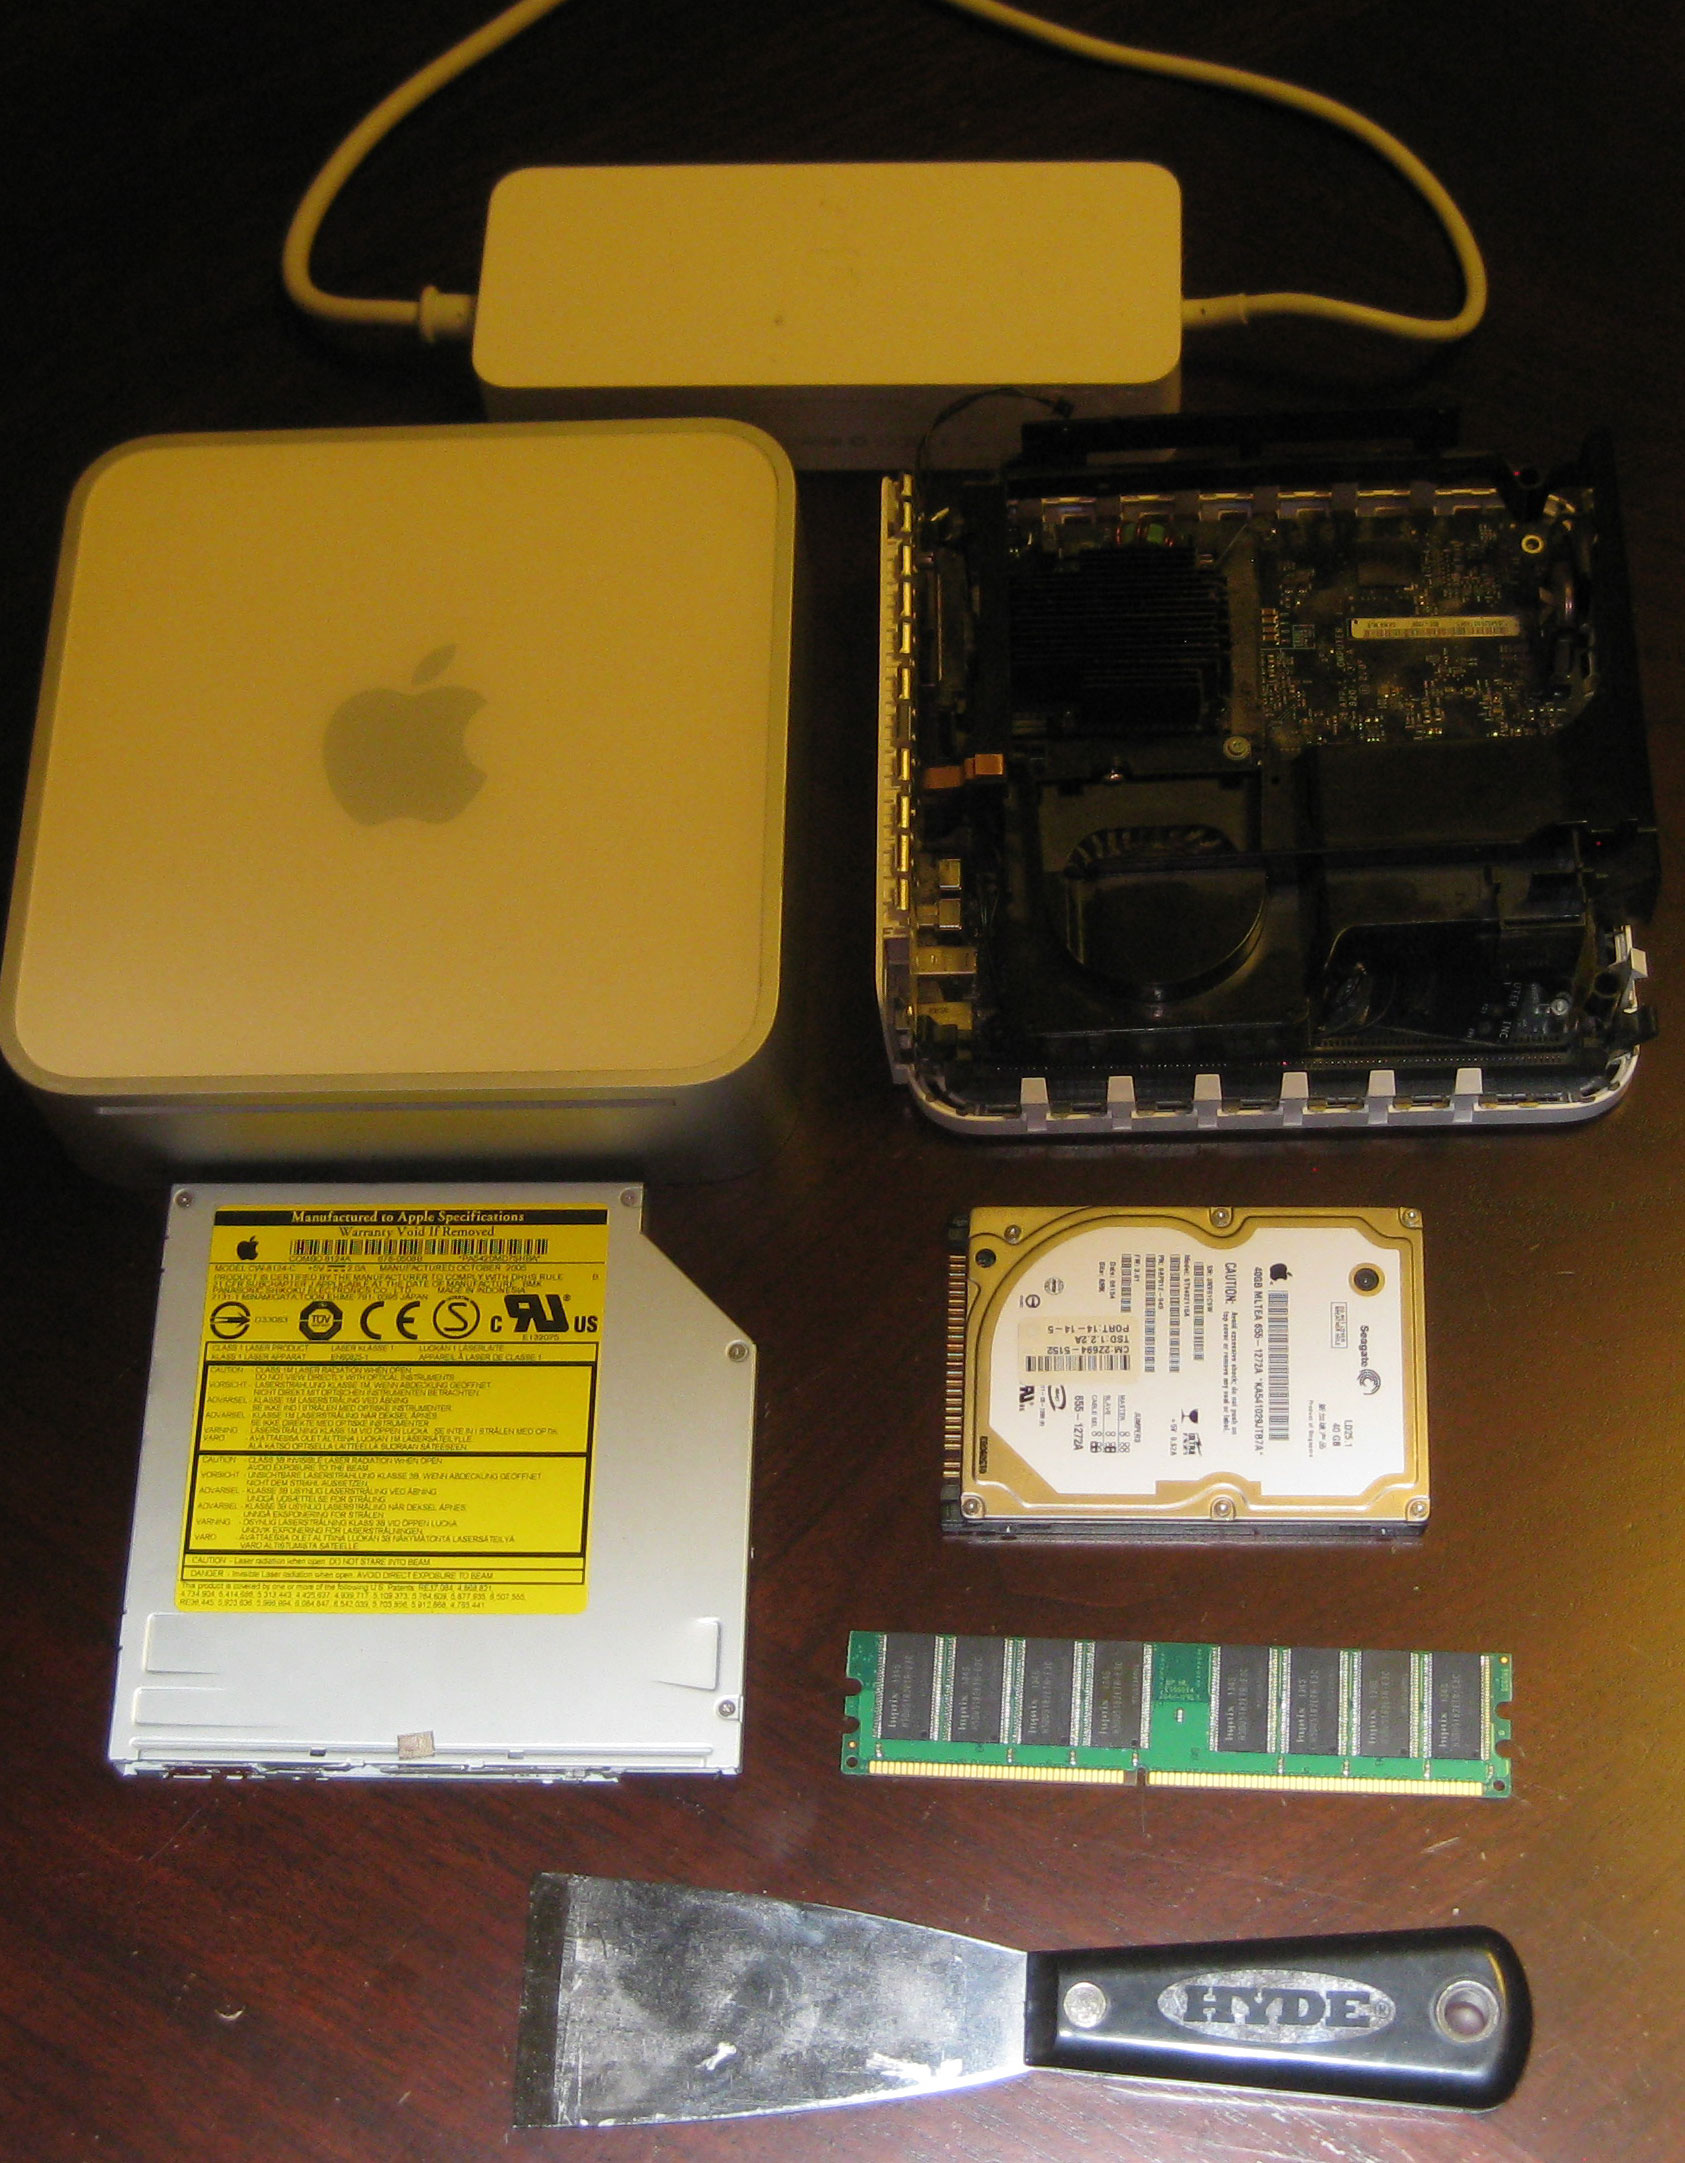
Click for larger image
I remember trying to find a Mac Mini PPC on Craigslist. Many were to be found, but all asked more than the price of even a new Mac Mini Intel, always because the seller was leaving all of last year’s applications and perhaps including a monitor, neither of which I needed. Fortunately, I found this bare Mac Mini. Also fortunate was the fact that it was far easier to install Linux on it than the first PowerPC machine I owned.
After FATE operation transitioned away from me, I still kept the machine in service as an edge server and automated backup machine. That is, until the hard drive failed on reboot one day. Thus, when it was finally time to recycle the computer, I felt it necessary to disassemble the machine and remove the hard drive for possible salvage and then for destruction.
If you’ve ever attempted to upgrade or otherwise service this style of Mac Mini, you will no doubt recognize the pictured paint scraper tool as standard kit. I have had that tool since I first endeavored to upgrade the RAM to 1 GB from the standard 1/2 GB. Performing such activities on a Mac Mini is tedious, but only if you care about putting it back together afterwards.
The next machine is a bit older. I put it together nearly a decade ago, early in 2005. This machine’s original duty was “download agent”– this would be more specifically called a BitTorrent machine in modern tech parlance. Back then, I placed it on someone else’s woefully underutilized home broadband connection (with their permission, of course) when I was too cheap to upgrade from dialup.

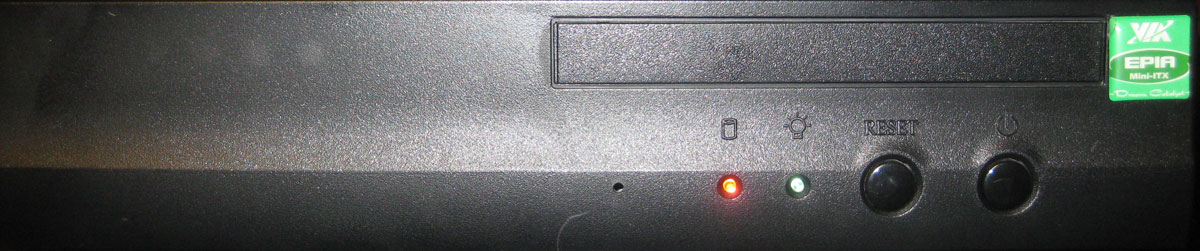
Click for larger image
This is a small form factor system from VIA that was clearly designed with home theater PC (HTPC) use cases in mind. It has a VIA C3 x86-compatible CPU (according to my notes, Centaur VIA Samuel 2 stepping 03, flags : fpu de tsc msr cx8 mtrr pge mmx 3dnow) and 128 MB of RAM (initially ; I upgraded it to 512 MB some years later, just for the sake of doing it). And then there was the 120 GB PATA HD for all that downloaded goodness.

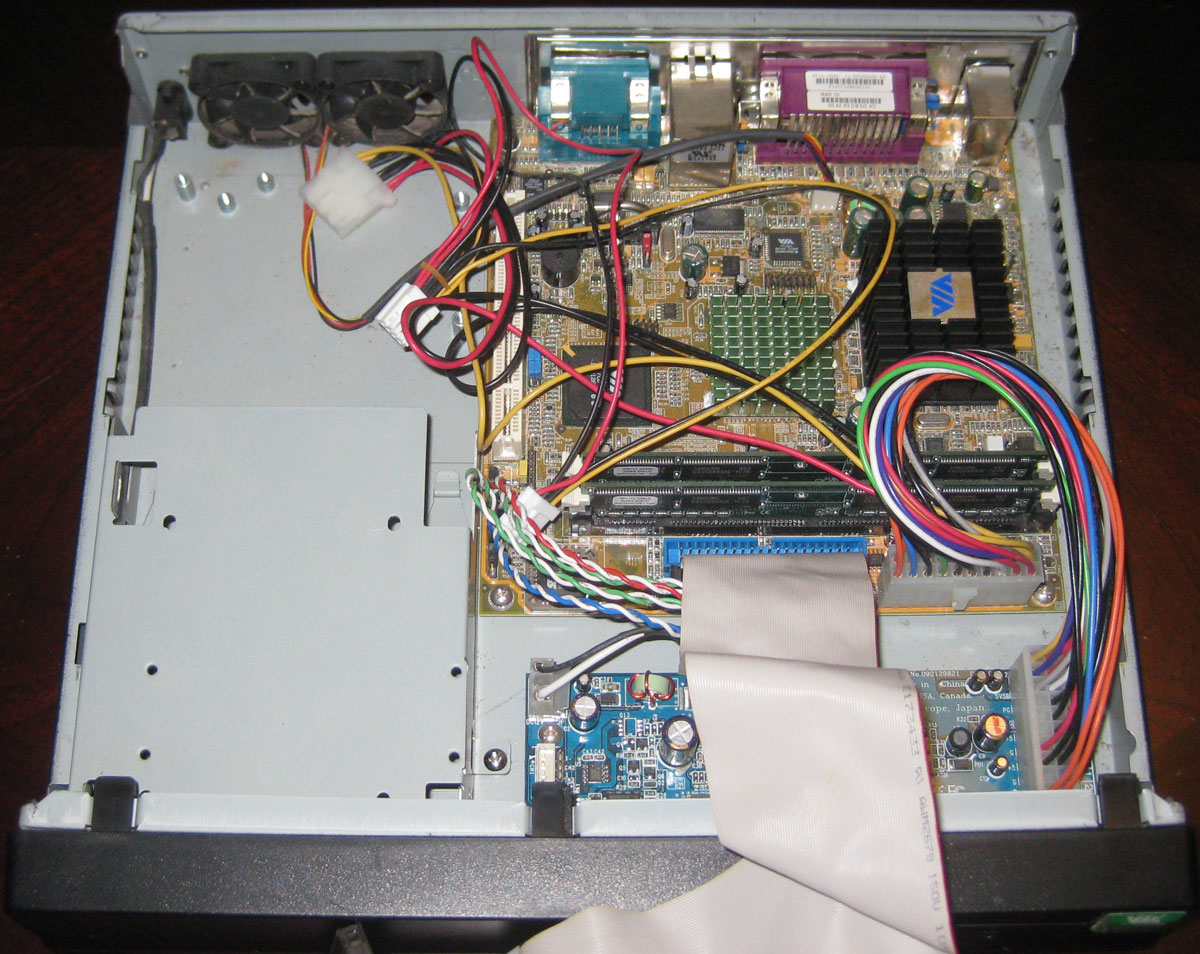
Click for larger image
I have specific memories of a time when my main computer at home wasn’t working correctly for one reason or another. Instead, I logged into this machine remotely via SSH to make several optimizations and fixes on FFmpeg’s VP3/Theora video decoder, all from the terminal, without being able to see the decoded images with my own eyes (which is why I insist that even blind people could work on video codecs).
By the time I got my own broadband, I had become inspired to attempt the automated build and test system for FFmpeg. This was the machine I used for prototyping early brainstorms of FATE. By the time I put a basic build/test system into place in early 2008, I had much faster computers that could build and test the project– obvious limitation of this machine is that it could take at least 1/2 hour to build the entire codebase, and that was the project from 8 years ago.
So the machine got stuffed in a closet somewhere along the line. The next time I pulled it out was in 2010 when I wanted to toy with Dreamcast programming once more (the machine appears in one of the photos in this post). This was the only machine I still owned which still had an RS-232 serial port (I didn’t know much about USB serial converters yet), plus it still had a bunch of pre-compiled DC homebrew binaries (I was having trouble getting the toolchain to work right).
The next time I dusted off this machine was late last year when I was trying some experiments with the Microsoft Xbox’s IDE drive (a photo in that post also shows the machine ; this thing shows up a lot on this blog). The VIA machine was the only machine I still owned which had 40-pin IDE connectors which was crucial to my experiment.
At this point, I was trying to make the machine more useful which meant replacing the ancient Gentoo Linux distribution as well as simply interacting with it via a keyboard and mouse. I have a long Evernote entry documenting a comedy of errors revolving around this little box. The interaction troubles were due to the fact that I didn’t have any PS/2 keyboards left and I couldn’t make a USB keyboard work with it. Diego was able to explain that I needed to flip a bit in the BIOS to address this which worked. As for upgrading the OS, I tried numerous Linux distributions large and small, mostly focusing on the small. None worked. I eventually learned that, while I was trying to use i686 distributions, this machine did not actually qualify as an i686 CPU ; installations usually booted but failed because the default kernel required the cmov instruction. I was advised to try i386 distros instead. My notes don’t indicate whether I had any luck on this front before I gave up and moved on.
I just made the connection that this VIA machine has two 40-pin IDE connectors which means that the thing was technically capable of supporting up to 4 IDE devices. Obviously, the computer couldn’t really accommodate that in terms of space or power. When I wanted to try installing a new OS, I needed take off the top and connect a rather bulky IDE CD-ROM drive. This computer’s casing was supposed to be able to support a slimline optical drive (perhaps like the type found in laptops), but I could never quite visualize how that was supposed to work, space-wise. When I disassembled the PowerPC Mac Mini, I realized I might be able to repurpose that machines optical drive for this computer. Obviously, I thought better of trying since both machines are off to the recycle pile.
I would still like to work on the Xbox project a bit more, but I procured a different, unused, much more powerful yet still old computer that has a motherboard with 1 PATA connector in addition to 6 SATA connectors. If I ever get around to toying with Linux kernel development, this should be a much more appropriate platform to use.
I thought about turning this machine into an old Windows XP (and lower, down to Windows 3.1) gaming platform ; the capabilities of the machine would probably be perfect for a huge portion of my Windows game collection. But I think the lack of an optical drive renders this idea intractable. External USB drives are likely out of the question since there is very little chance that this motherboard featured USB 2.0 (the specs don’t mention 2.0, so the USB ports are probably 1.1).
So it is with fond memories that I send off both machines, sans hard drives, to the recycle pile. I’m still deciding on an appropriate course of action for failed hard drives, though.
-
What is Behavioural Segmentation and Why is it Important ?
28 septembre 2023, par Erin — Analytics Tips


-
Cohort Analysis 101 : How-To, Examples & Top Tools
13 novembre 2023, par Erin — Analytics Tips