Recherche avancée
Autres articles (29)
-
MediaSPIP v0.2
21 juin 2013, parMediaSPIP 0.2 est la première version de MediaSPIP stable.
Sa date de sortie officielle est le 21 juin 2013 et est annoncée ici.
Le fichier zip ici présent contient uniquement les sources de MediaSPIP en version standalone.
Comme pour la version précédente, il est nécessaire d’installer manuellement l’ensemble des dépendances logicielles sur le serveur.
Si vous souhaitez utiliser cette archive pour une installation en mode ferme, il vous faudra également procéder à d’autres modifications (...) -
Mise à disposition des fichiers
14 avril 2011, parPar défaut, lors de son initialisation, MediaSPIP ne permet pas aux visiteurs de télécharger les fichiers qu’ils soient originaux ou le résultat de leur transformation ou encodage. Il permet uniquement de les visualiser.
Cependant, il est possible et facile d’autoriser les visiteurs à avoir accès à ces documents et ce sous différentes formes.
Tout cela se passe dans la page de configuration du squelette. Il vous faut aller dans l’espace d’administration du canal, et choisir dans la navigation (...) -
MediaSPIP version 0.1 Beta
16 avril 2011, parMediaSPIP 0.1 beta est la première version de MediaSPIP décrétée comme "utilisable".
Le fichier zip ici présent contient uniquement les sources de MediaSPIP en version standalone.
Pour avoir une installation fonctionnelle, il est nécessaire d’installer manuellement l’ensemble des dépendances logicielles sur le serveur.
Si vous souhaitez utiliser cette archive pour une installation en mode ferme, il vous faudra également procéder à d’autres modifications (...)
Sur d’autres sites (2392)
-
Top 5 Web Analytics Tools for Your Site
11 août 2023, par Erin — Analytics Tips


-
What is a Cohort Report ? A Beginner’s Guide to Cohort Analysis
3 janvier 2024, par Erin


Try Matomo for Free
21 day free trial. No credit card required.
-
My SBC Collection
31 décembre 2023, par Multimedia Mike — GeneralLike many computer nerds in the last decade, I have accumulated more than a few single-board computers, or “SBCs”, which are small computers based around a system-on-a-chip (SoC) that nearly always features an ARM CPU at its core. Surprisingly few of these units are Raspberry Pi units, though that brand has come to exemplify and dominate the product category.
Also, as is the case for many computer nerds, most of these SBCs lay fallow for years at a time. Equipped with an inexpensive lightbox that I procured in the last year, I decided I could at least create glamour shots of various units and catalog them in a blog post.
While Raspberry Pi still enjoys the most mindshare far and away, and while I do have a few Raspberry Pi units in my inventory, I have always been a bigger fan of the ODROID brand, which works with convenient importers around the world (in the USA, I can vouch for Ameridroid, to whom I’ve forked over a fair amount of cash for these computing toys).
As mentioned, Raspberry Pi undisputedly has the most mindshare of all these SBC brands and I often wonder why… and then I immediately remind myself that it has the biggest ecosystem, and has a variety of turnkey projects and applications (such as Pi-hole and PiVPN) that promise a lower barrier to entry — as well as a slightly lower price point — than some of these other options. ODROID had a decent ecosystem for awhile, especially considering the monthly ODROID Magazine, though that ceased publication in July 2020. The Raspberry Pi and its variants were famously difficult to come by due to the global chip shortage from 2021-2023. Meanwhile, I had no trouble procuring these boards during the same timeframe.
So let’s delve into the collection…
Cubieboard
The Raspberry Pi came out in 2012 and by 2013 I was somewhat coveting one to hack on. Finally ! An accessible ARM platform to play with. I had heard of the BeagleBoard for years but never tried to get my hands on one. I was thinking about taking the plunge on a new Raspberry Pi, but a colleague told me I should skip that and go with this new hotness called the Cubieboard, based on an Allwinner SoC. The big value-add that this board had vs. a Raspberry Pi was that it had a SATA adapter. Although now that it has been a decade, it only now occurs to me to quander whether it was true SATA or a USB-to-SATA bridge. Looking it up now, I’m led to believe that the SoC supported the functionality natively.Anyway, I did get it up and running but never did much with it, thus setting the tone for future SBC endeavors. No photos because I gave it to another tech enthusiast years ago, whose SBC collection dwarfs my own.
ODROID-XU4
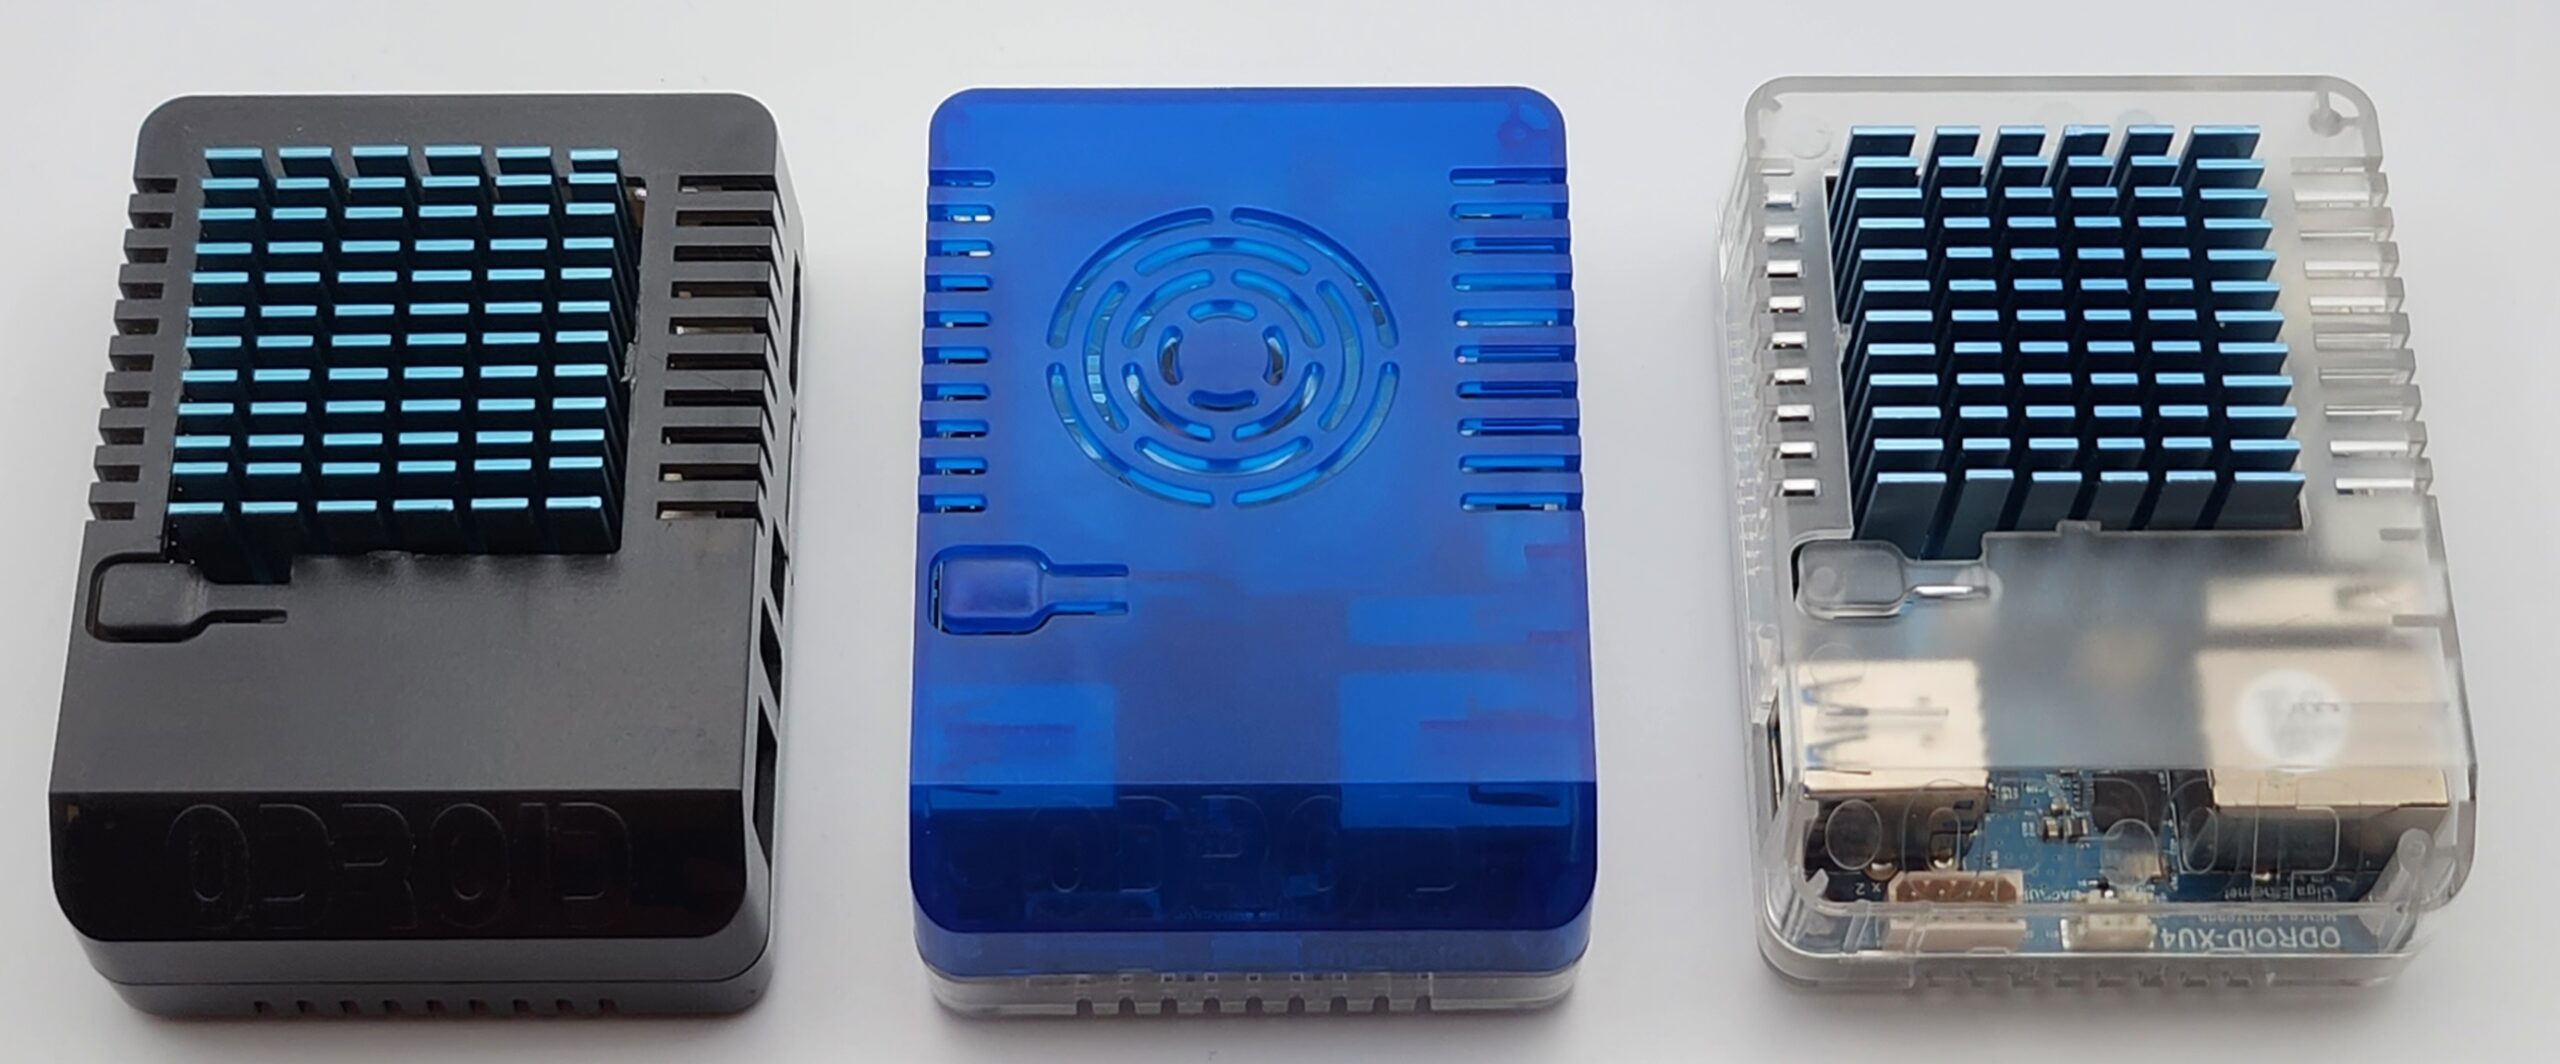
I can’t recall exactly when or how I first encountered the ODROID brand. I probably read about it on some enthusiast page or another circa 2014 and decided to try one out. I eventually acquired a total of 3 of these ODROID-XU4 units, each with a different case, 1 with a fan and 2 passively-cooled :
Collection of ODROID-XU4 SBCs
This is based on the Samsung Exynos 5422 SoC, the same series as was used in their Note 3 phone released in 2013. It has been a fun chip to play with. The XU4 was also my first introduction to the eMMC storage solution that is commonly supported on the ODROID SBCs (alongside micro-SD). eMMC offers many benefits over SD in terms of read/write speed as well as well as longevity/write cycles. That’s getting less relevant these days, however, as more and more SBCs are being released with direct NVMe SSD support.
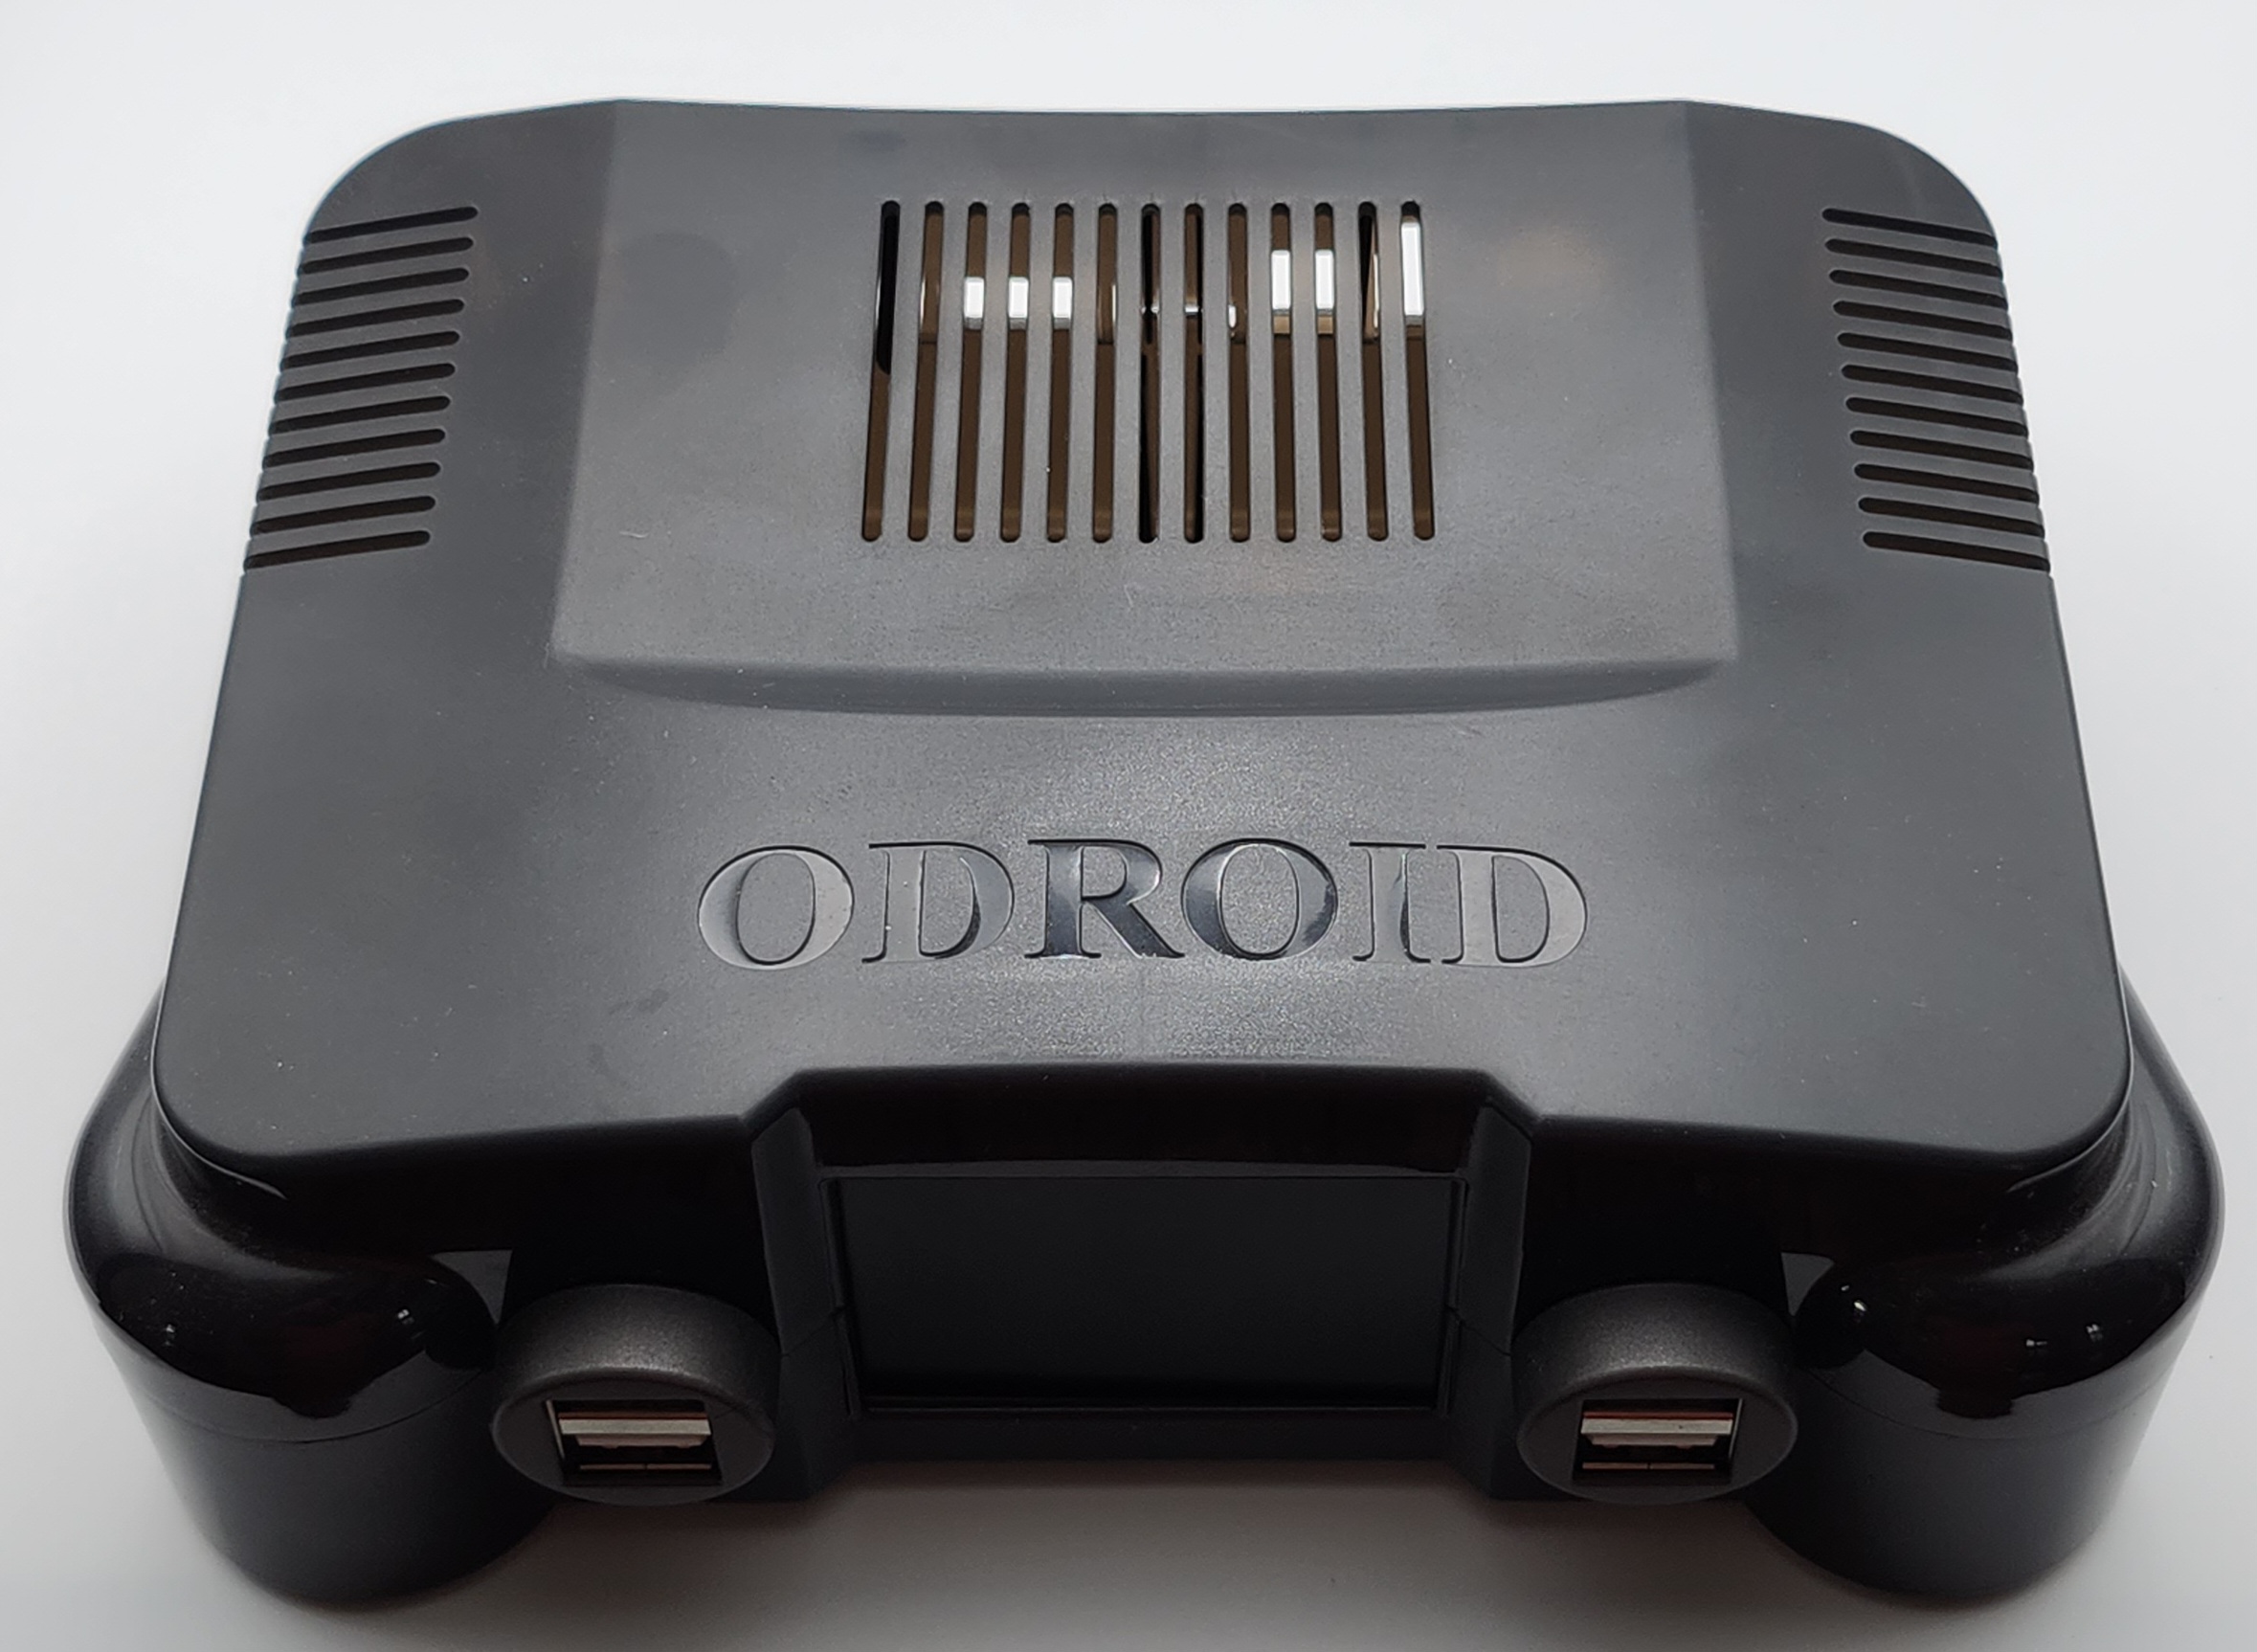
I had initially wanted to make a retro-gaming device built on this platform (see the handheld section later for more meditations on that). In support of this common hobbyist goal, there is this nifty case XU4 case which apes the aesthetic of the Nintendo N64 :

ODROID-XU4 N64-style case
It even has a cool programmable LCD screen. Maybe one day I’ll find a use for it.
For awhile, one of these XU4 units (likely the noisy, fan-cooled one) was contributing results to the FFmpeg FATE system.
While it features gigabit ethernet and a USB3 port, I once tried to see if I could get 2 Gbps throughput with the unit using a USB3-gigabit dongle. I had curious results in that the total amount of traffic throughput could never exceed 1 Gbps across both interfaces. I.e., if 1 interface was dealing with 1 Gbps and the other interface tried to run at 1 Gbps, they would both only run at 500 Mbps. That remains a mystery to me since I don’t see that limitation with Intel chips.
Still, the XU4 has been useful for a variety of projects and prototyping over the years.
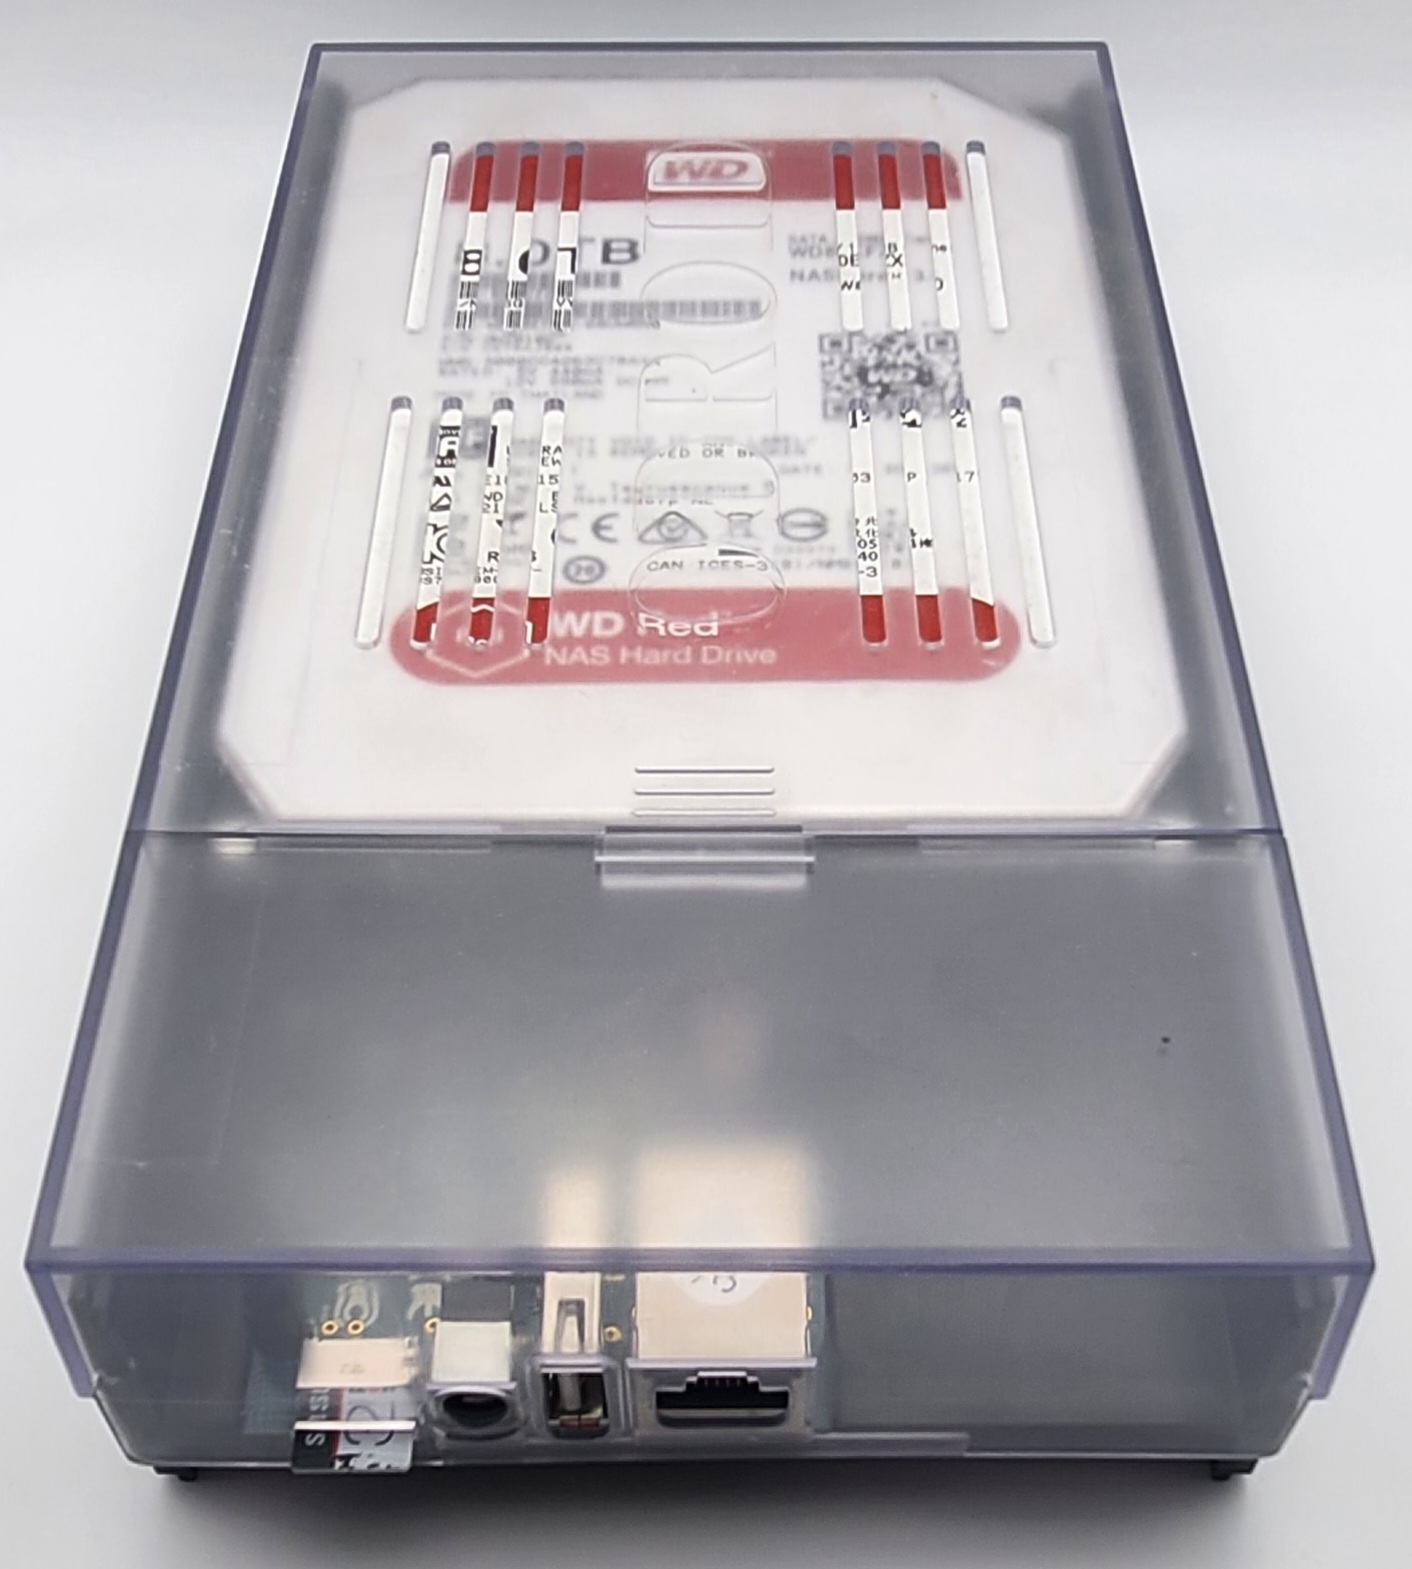
ODROID-HC2 NAS
I find that a lot of my fellow nerds massively overengineer their homelab NAS setups. I’ll explore this in a future post. For my part, people tend to find my homelab NAS solution slightly underengineered. This is the ODROID-HC2 (the “HC” stands for “Home Cloud”) :
ODROID-HC2 NAS
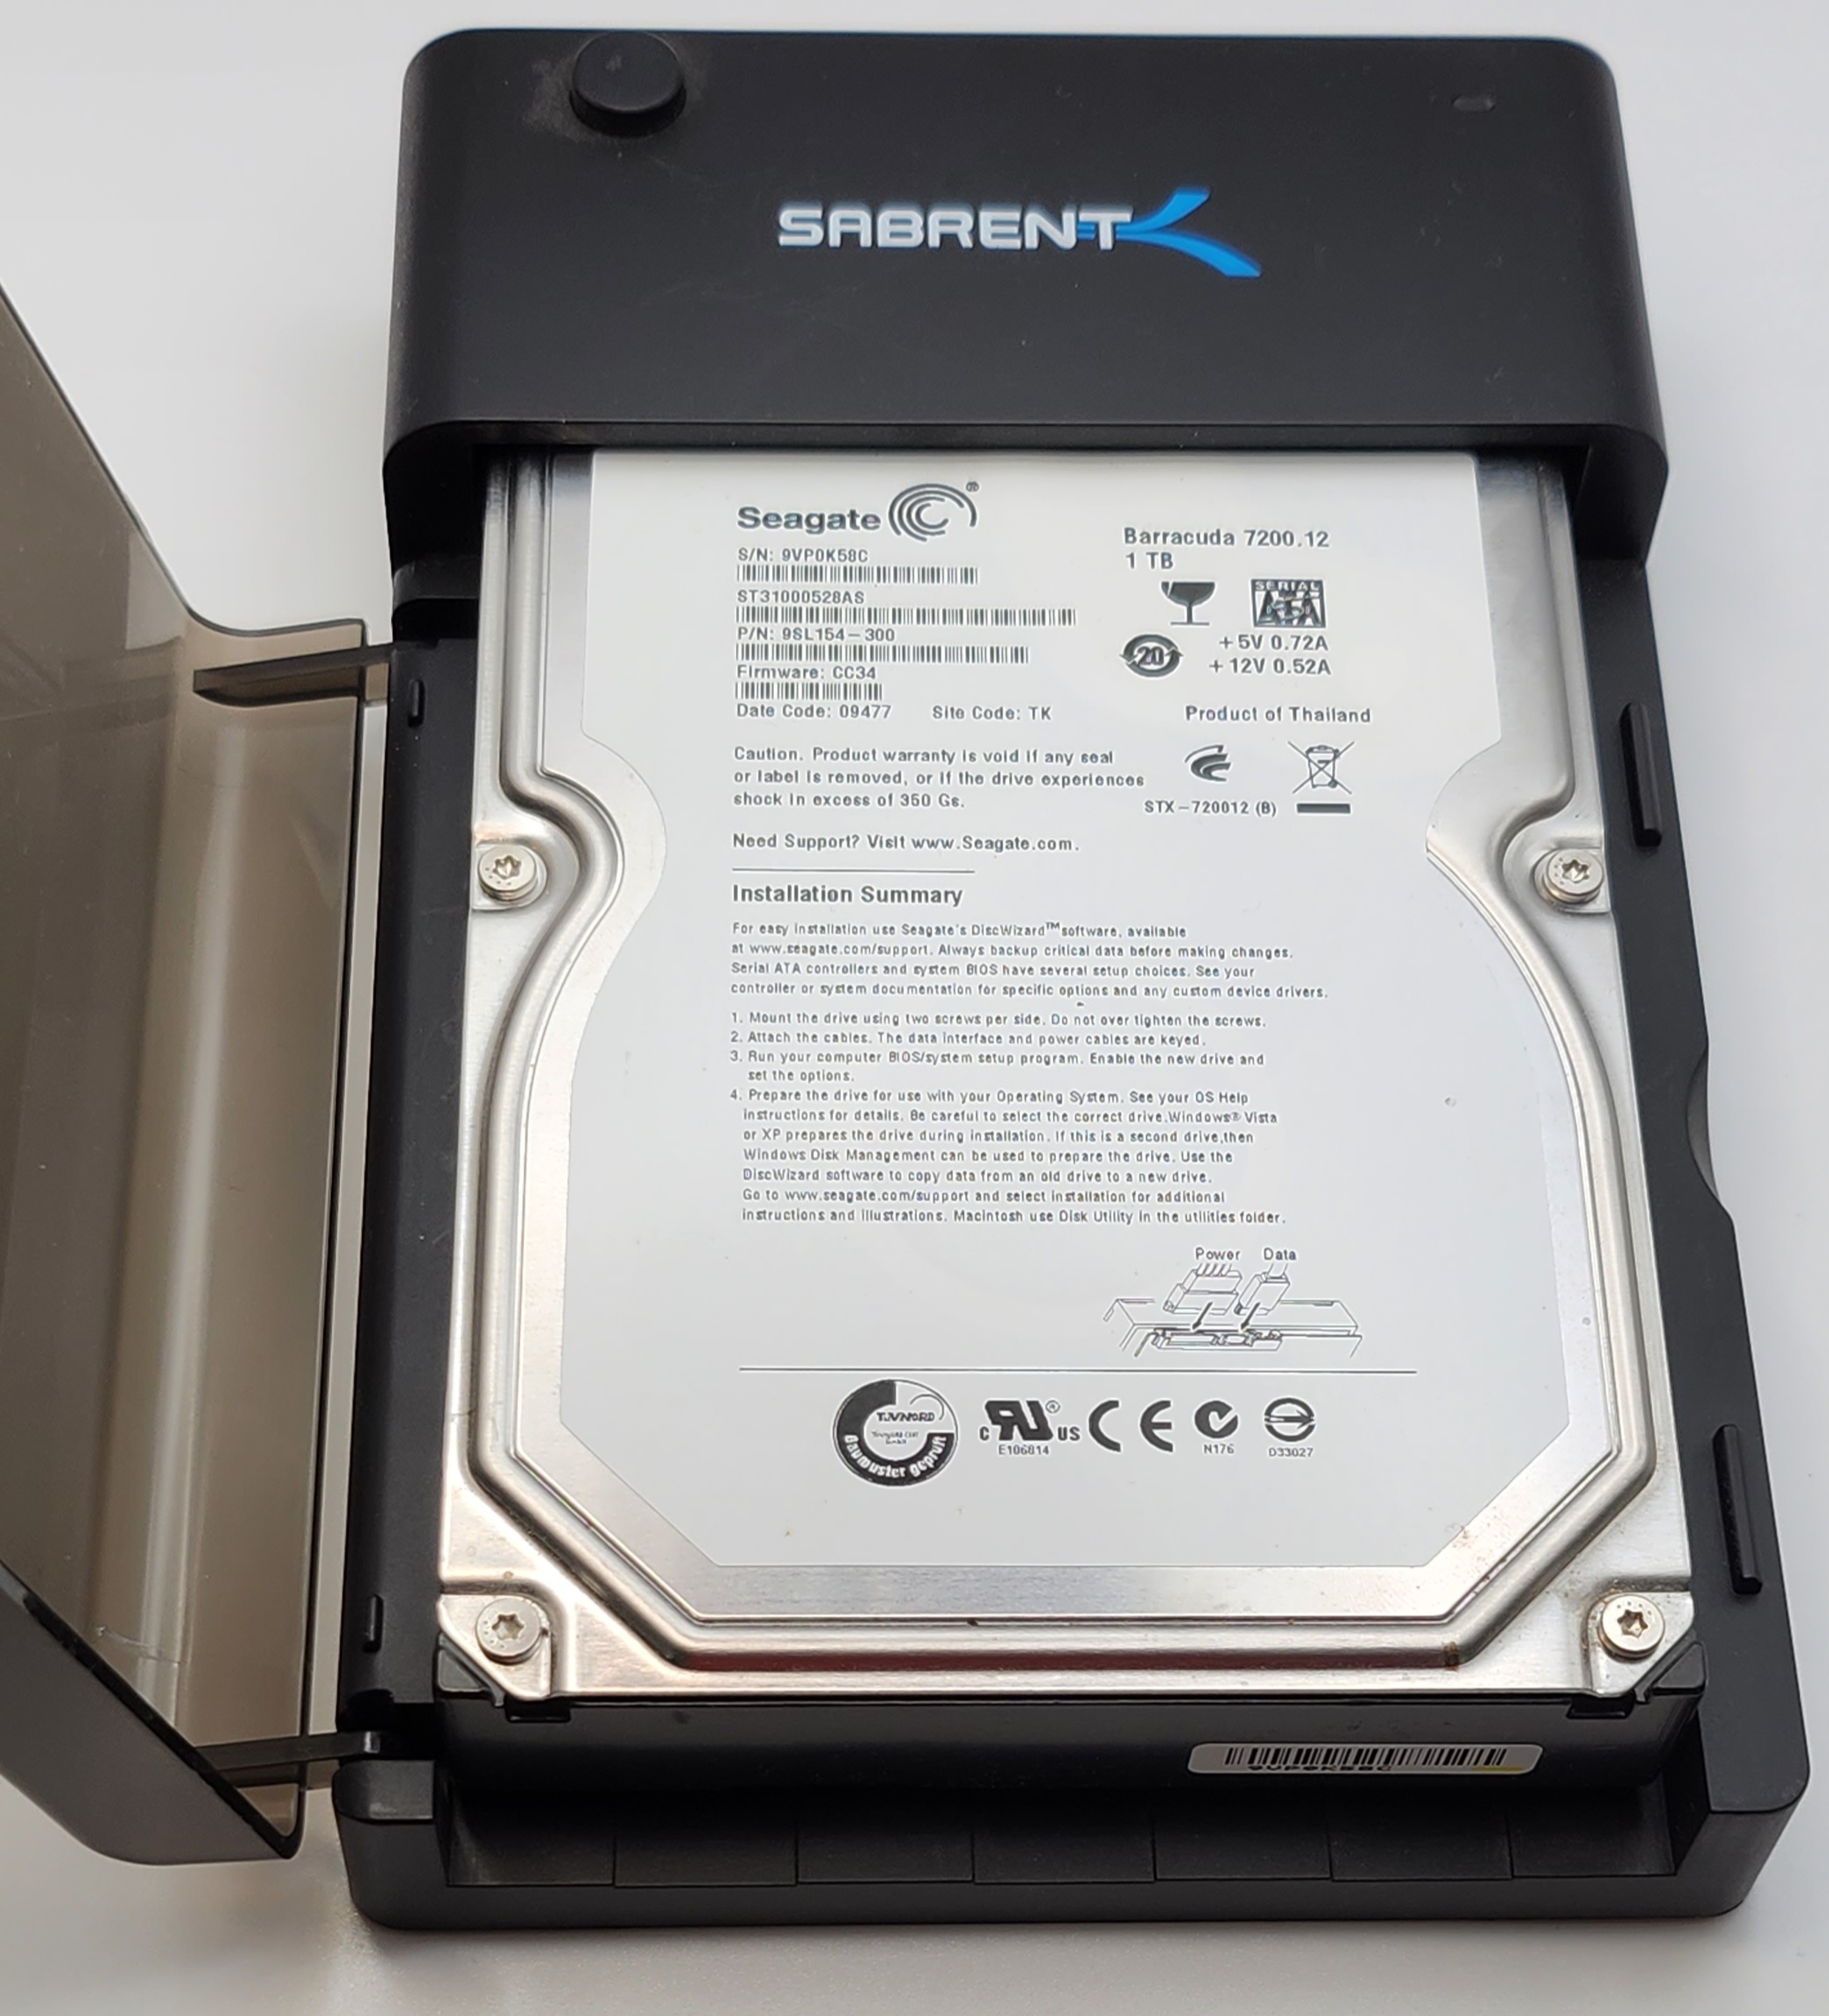
It has the same guts as the ODROID-XU4 except no video output and the USB3 function is leveraged for a SATA bridge. This allows you to plug a SATA hard drive directly into the unit :

ODROID-HC2 NAS uncovered
Believe it or not, this has been my home NAS solution for something like 6 or 7 years now– I don’t clearly remember when I purchased it and put it into service.
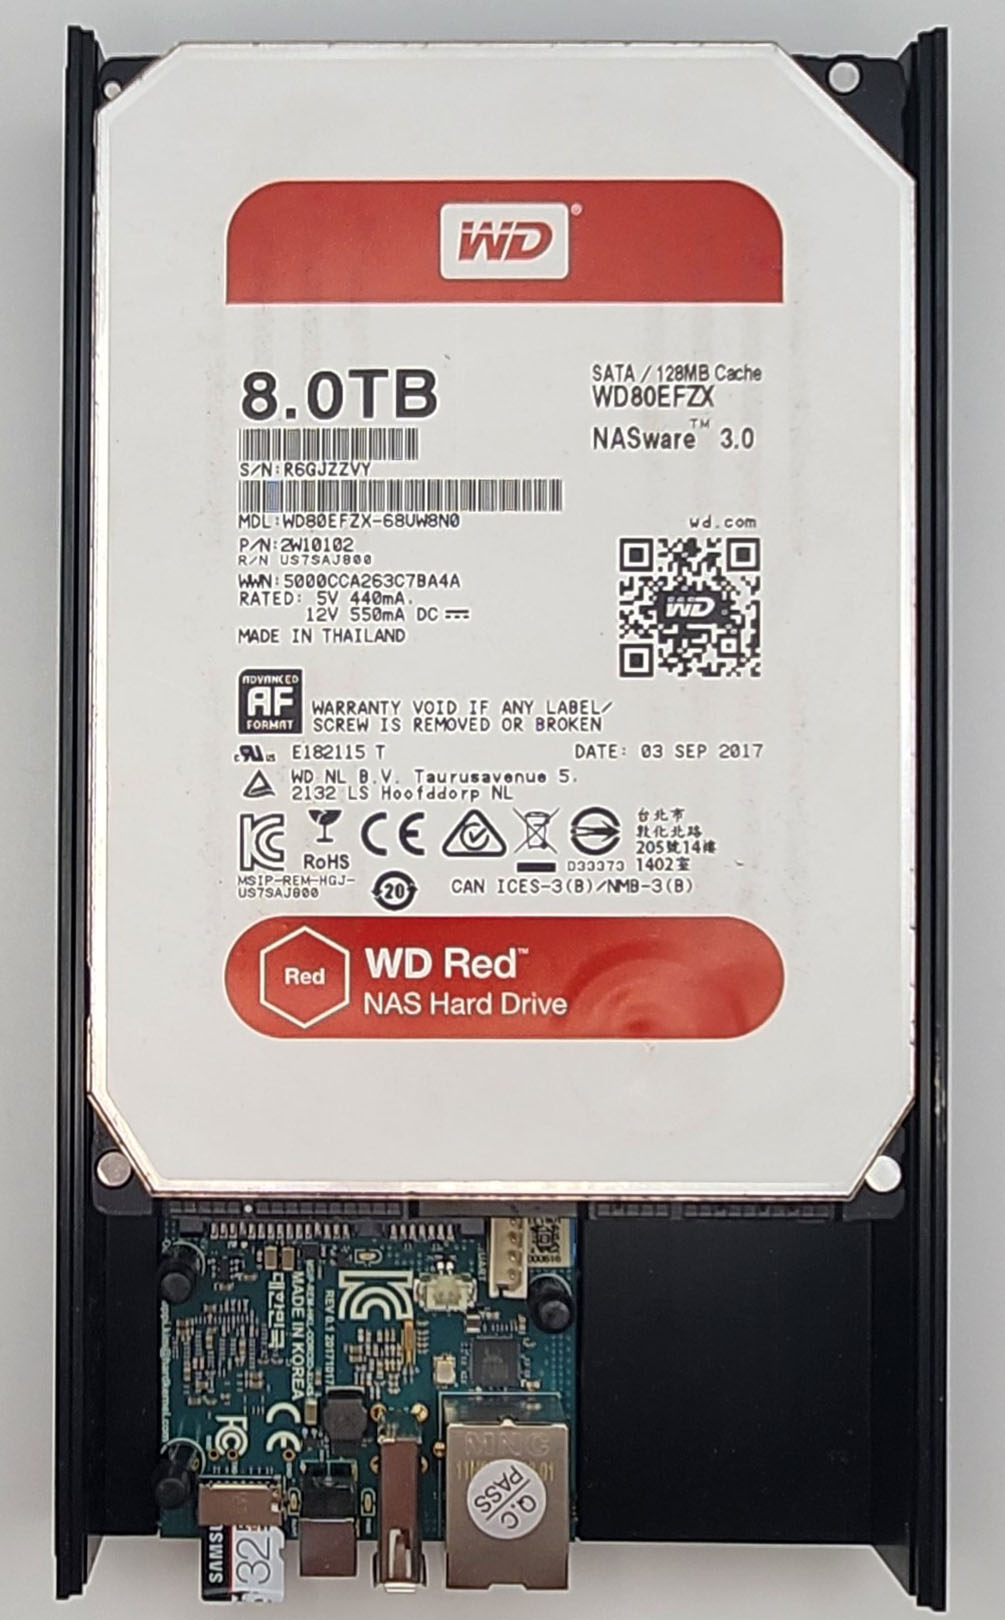
But isn’t this sort of irresponsible ? What about a failure of the main drive ? That’s why I have an external drive connected for backing up the most important data via rsync :

ODROID-HC2 NAS backup enclosure
The power consumption can’t be beat– Profiling for a few weeks of average usage worked out to 4.5 kWh for the ODROID-HC2… per month.
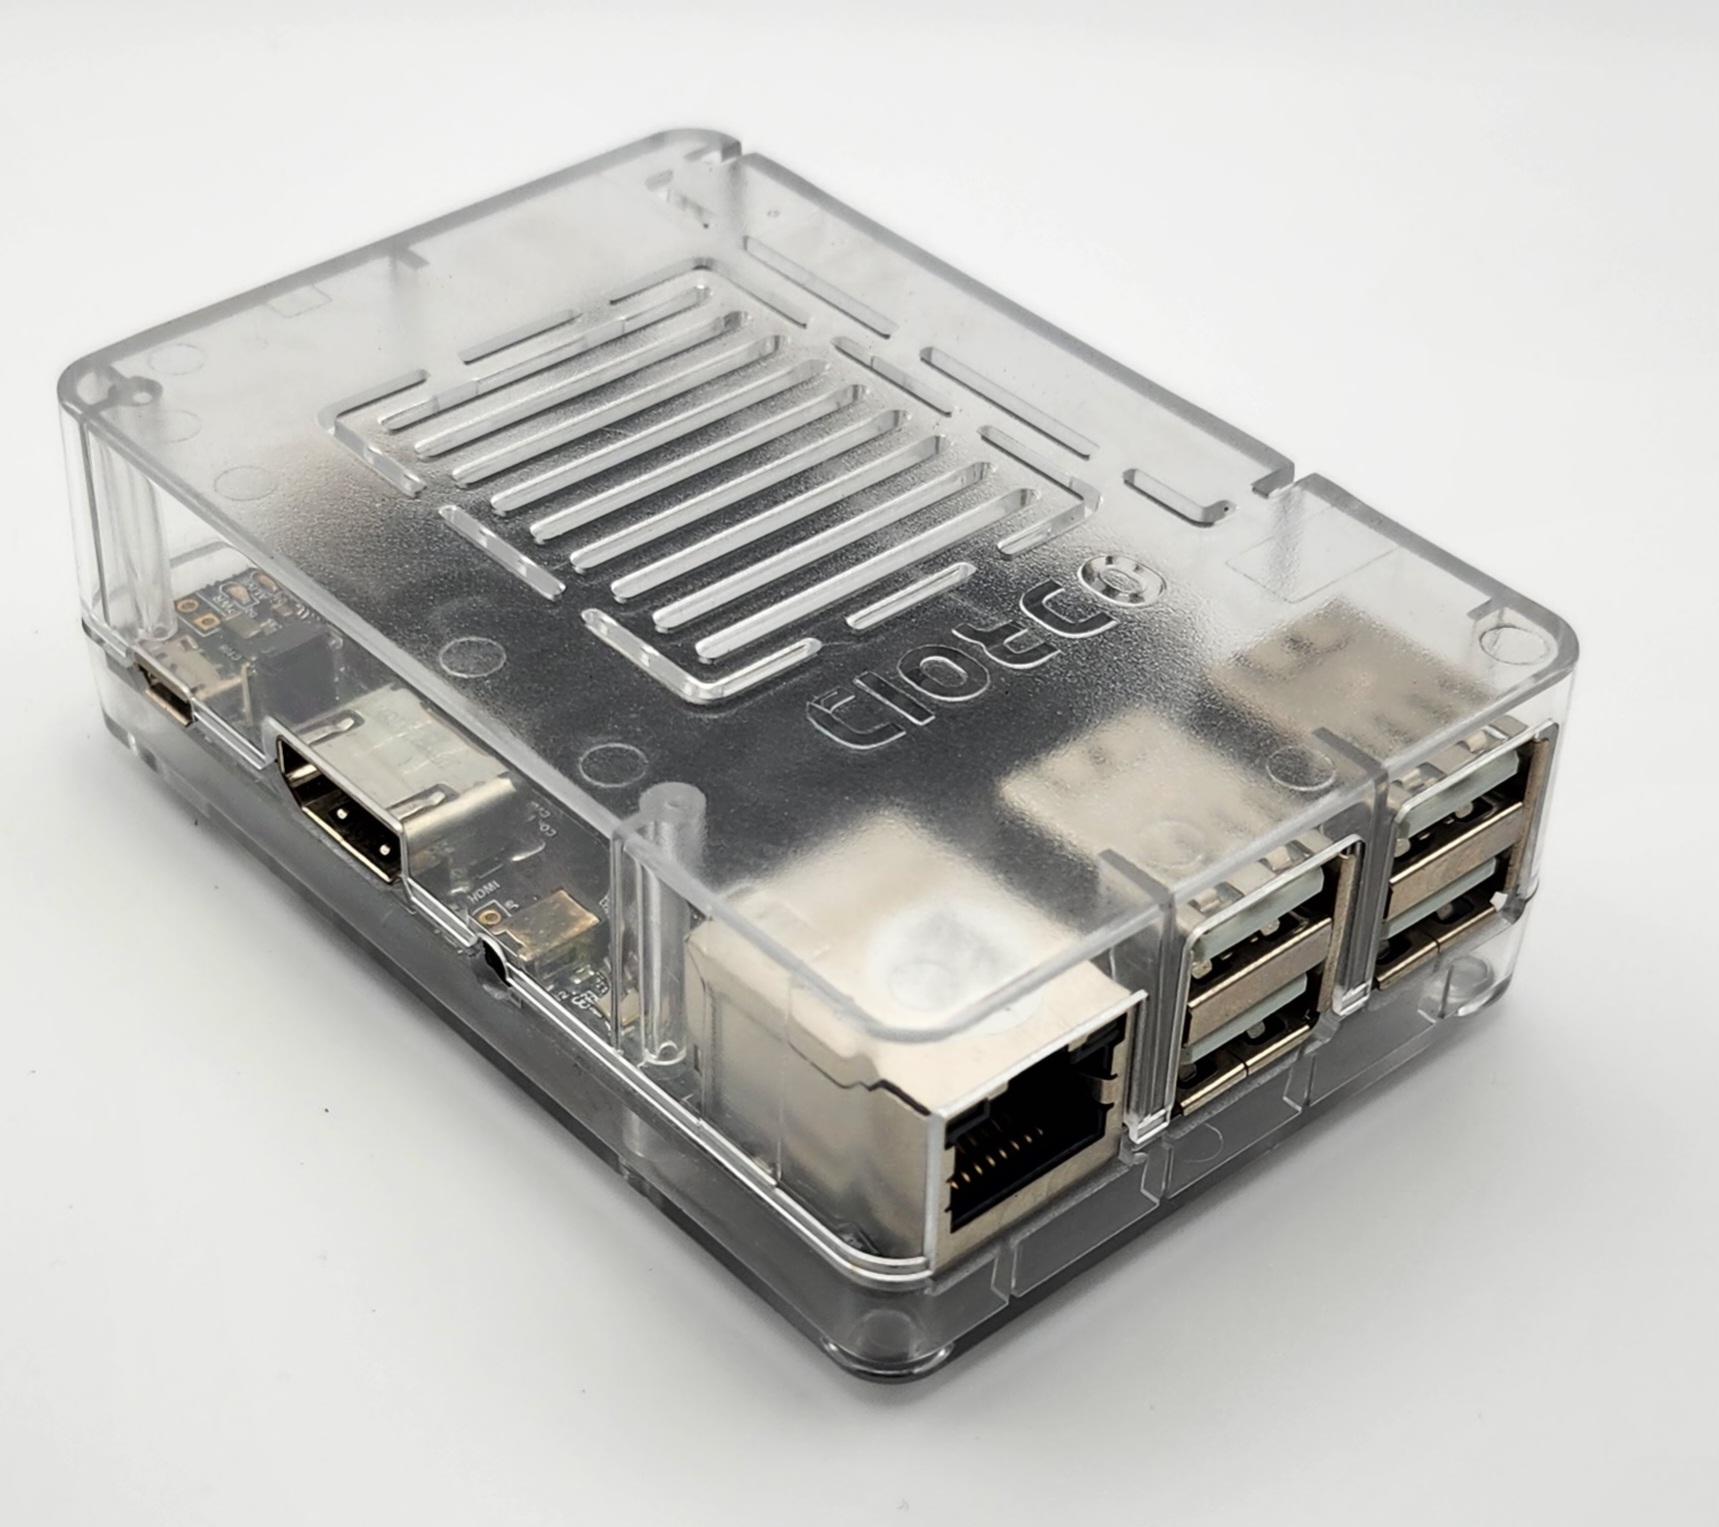
ODROID-C2
I was on a kick of ordering more SBCs at one point. This is the ODROID-C2, equipped with a 64-bit Amlogic SoC :
ODROID-C2
I had this on the FATE farm for awhile, performing 64-bit ARM builds (vs. the XU4’s 32-bit builds). As memory serves, it was unreliable and would occasionally freeze up.
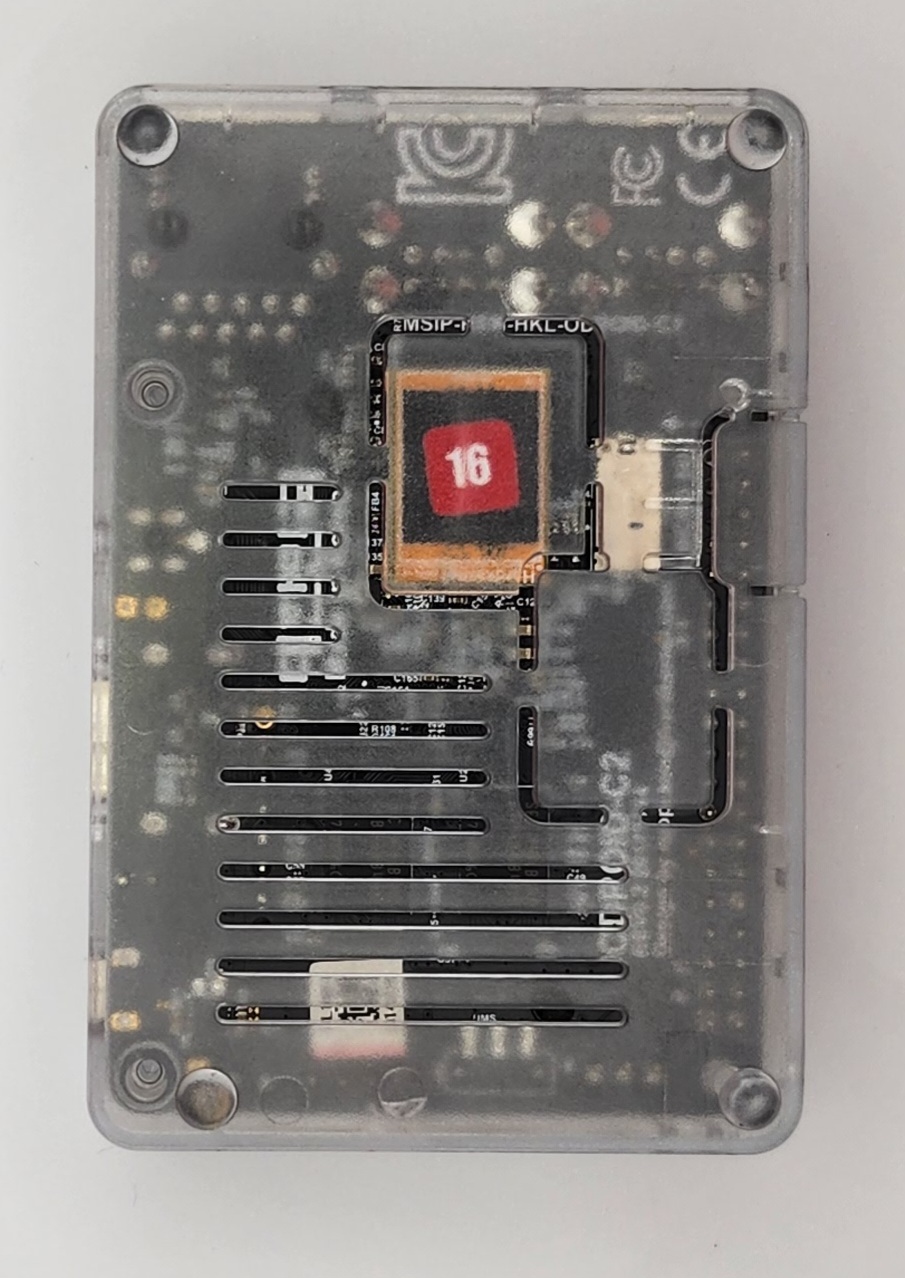
Here is a view of the eMMC storage through the bottom of the translucent case :

Bottom of ODROID-C2 with view of eMMC storage
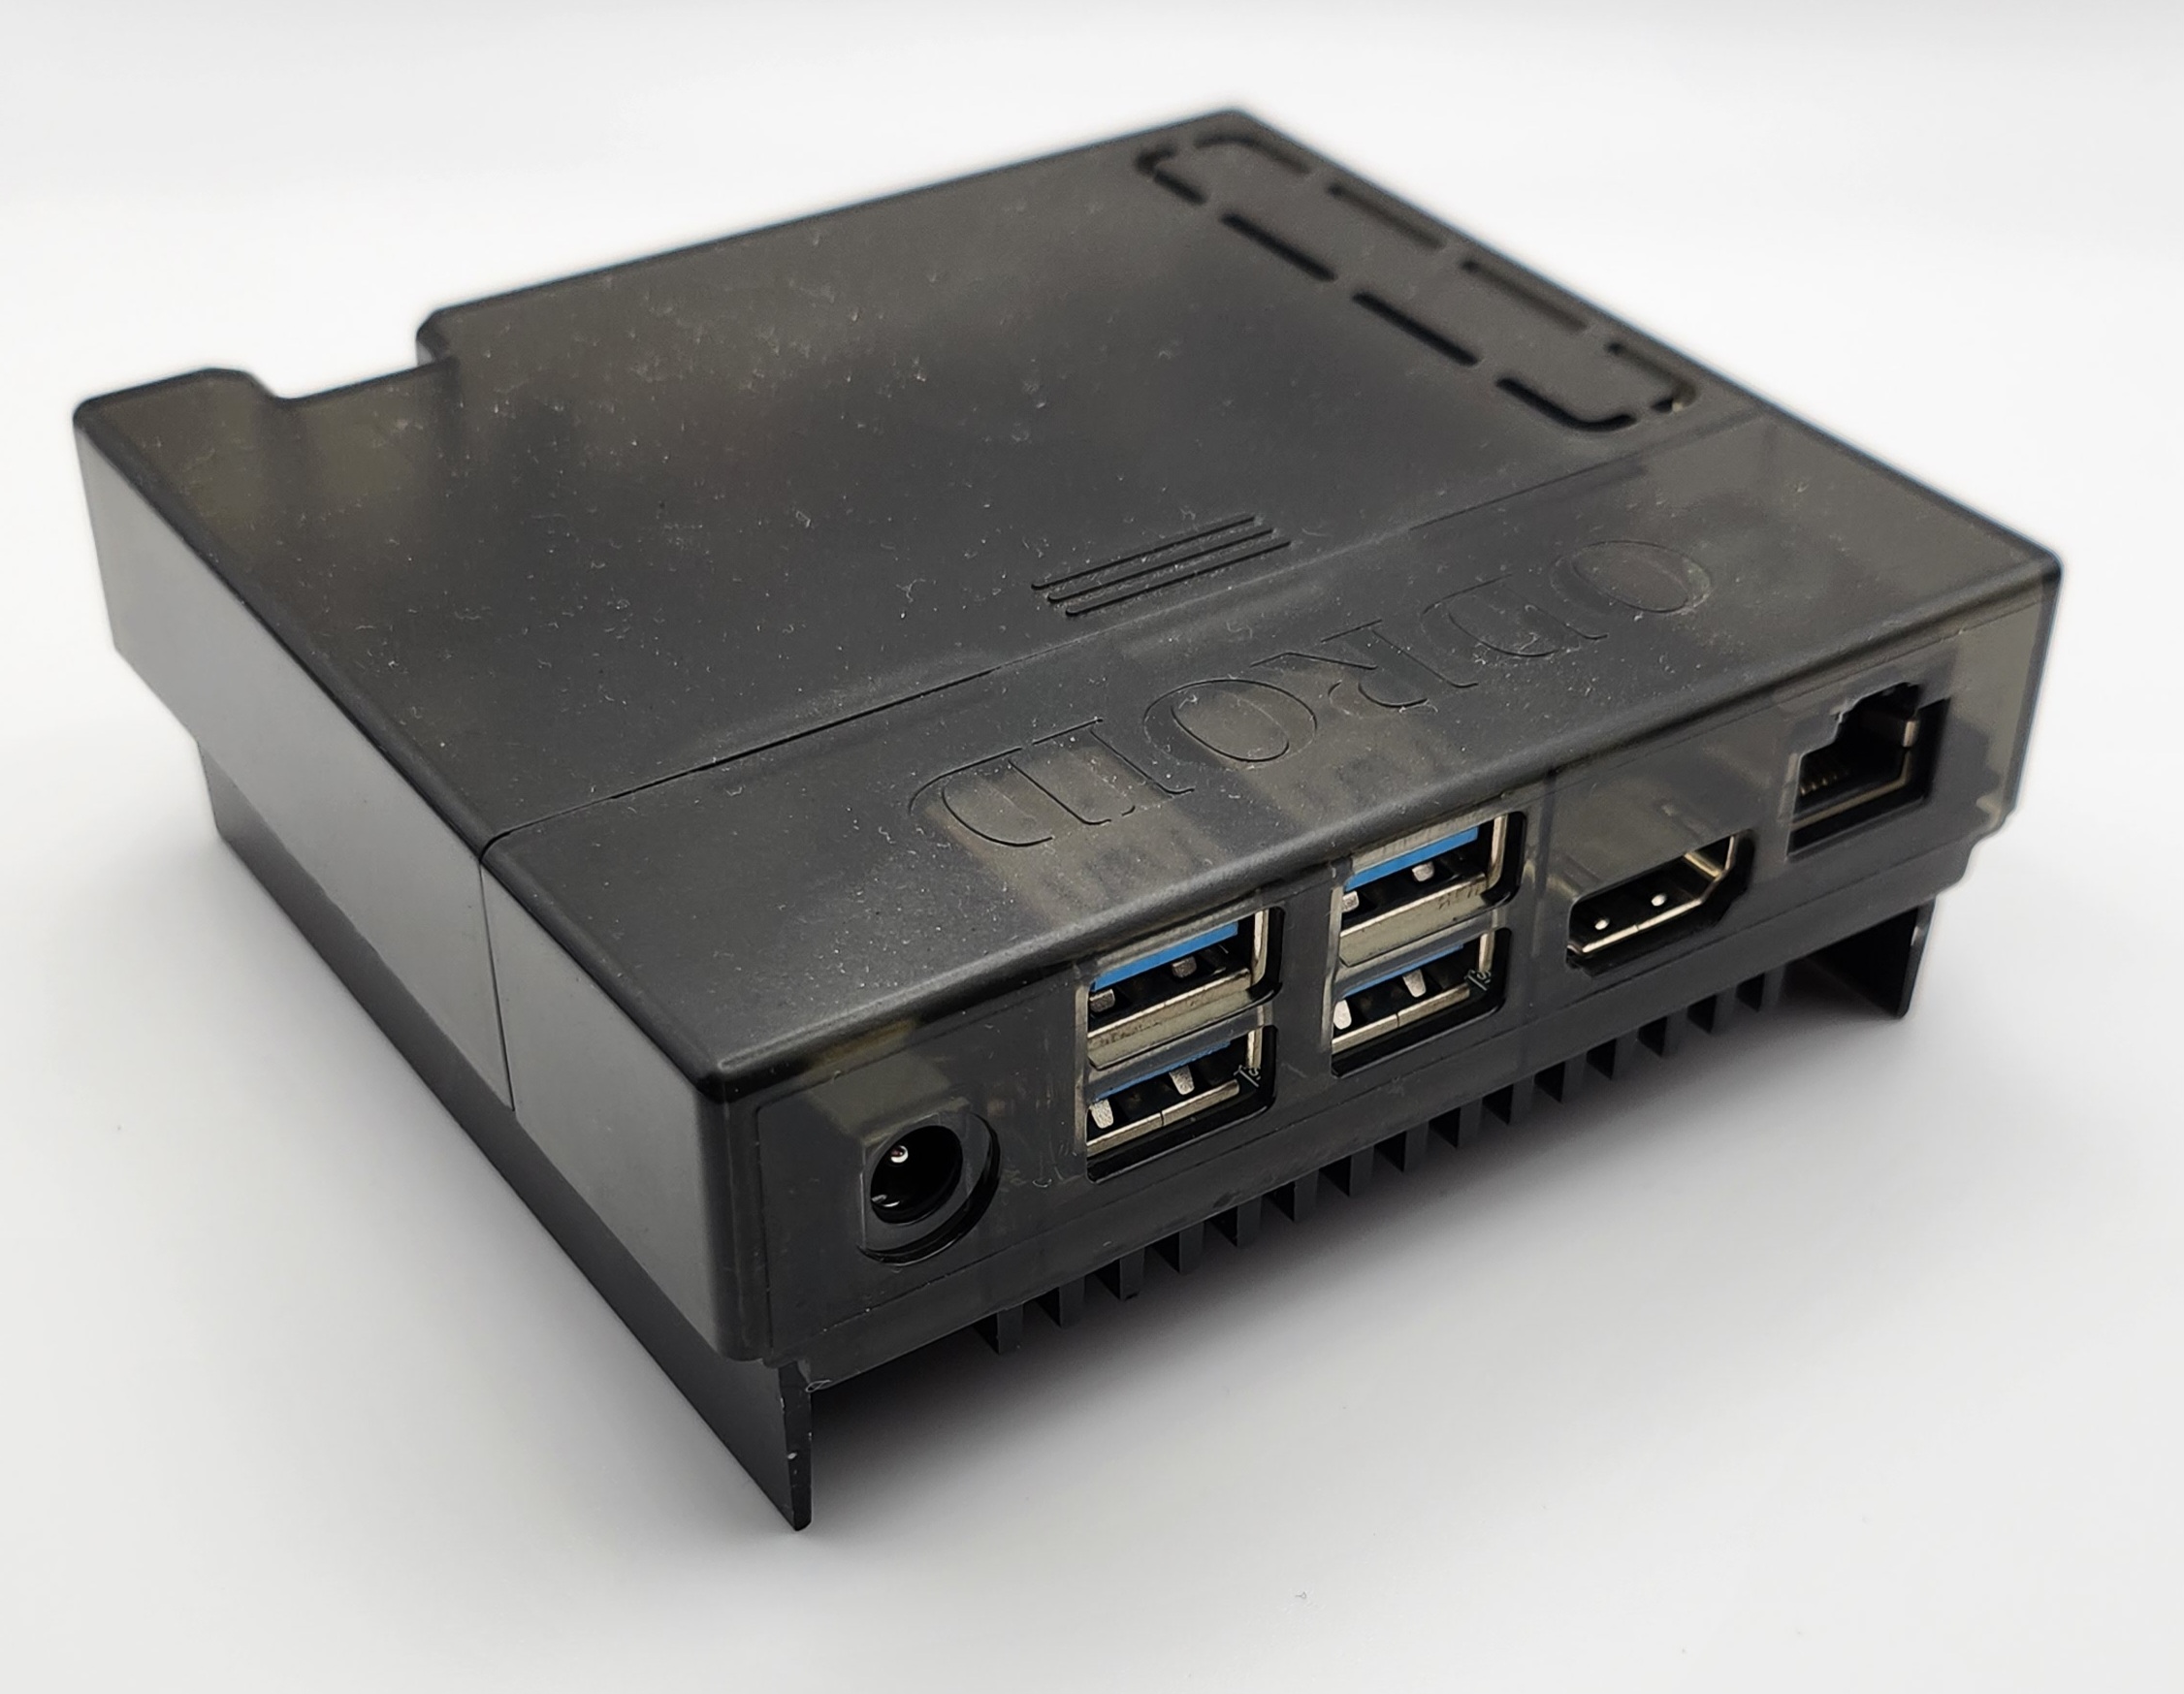
ODROID-N2+
Out of all my ODROID SBCs, this is the unit that I long to “get back to” the most– the ODROID-N2+ :
ODROID-N2+
Very capable unit that makes a great little desktop. I have some projects I want to develop using it so that it will force me to have a focused development environment.
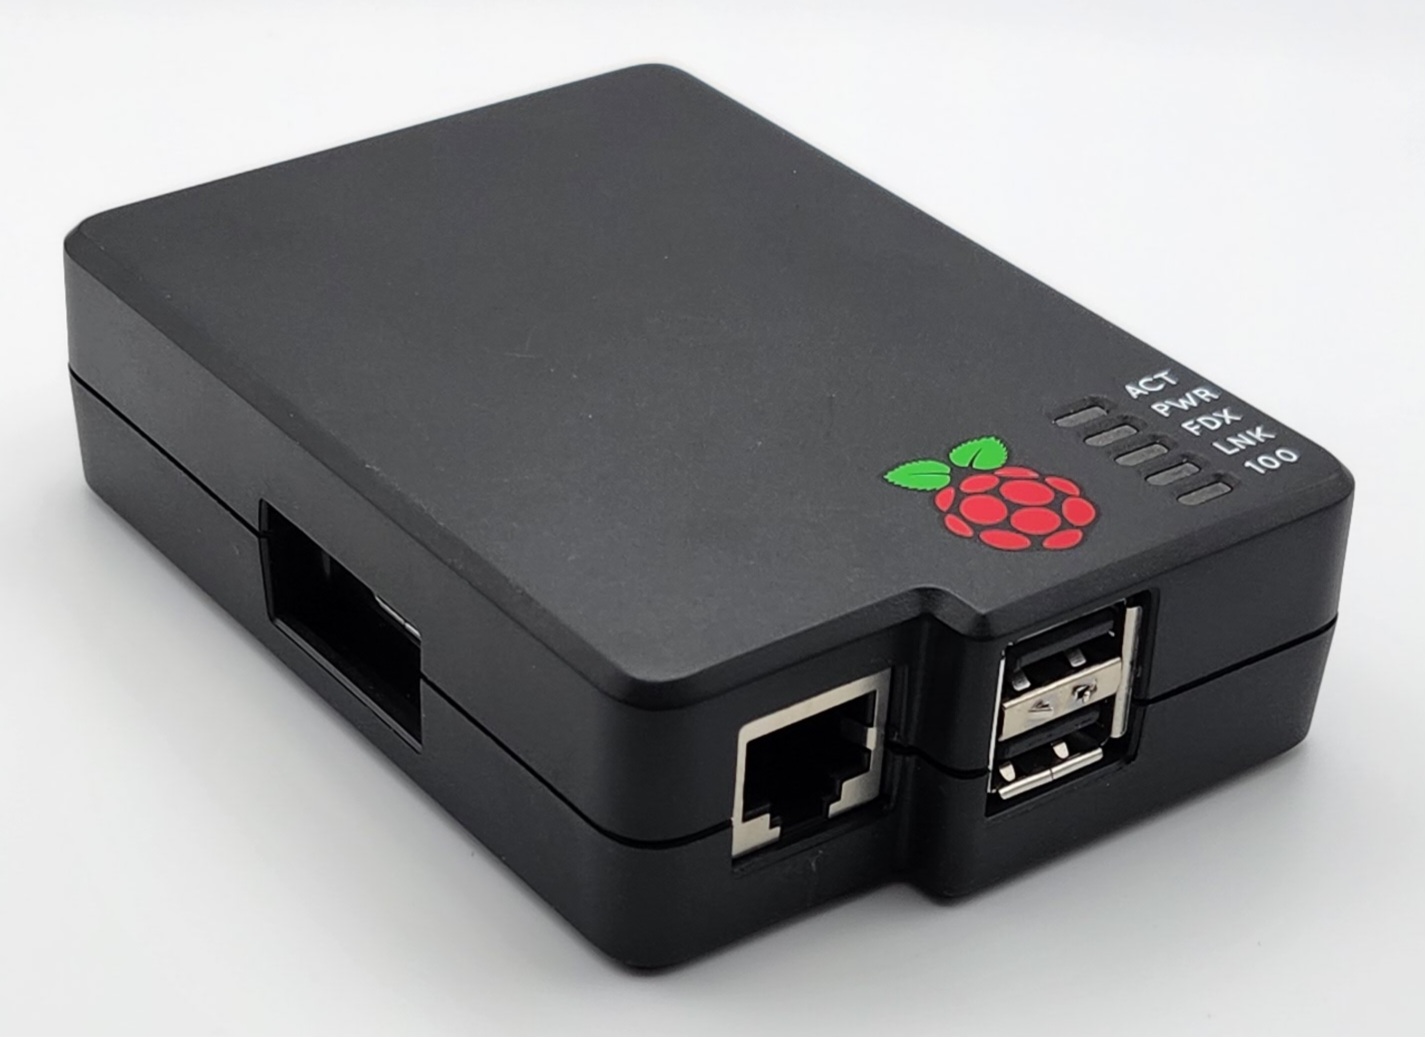
Raspberry Pi
Eventually, I did break down and get a Raspberry Pi. I had a specific purpose in mind and, much to my surprise, I have stuck to it :
Original Raspberry Pi
I was using one of the ODROID-XU4 units as a VPN gateway. Eventually, I wanted to convert the XU4 to something else and I decided to run the VPN gateway as an appliance on the simplest device I could. So I procured this complete hand-me-down unit from eBay and went to work. This was also the first time I discovered the DietPi distribution and this box has been in service running Wireguard via PiVPN for many years.
I also have a Raspberry Pi 3B+ kicking around somewhere. I used it as a Steam Link device for awhile.
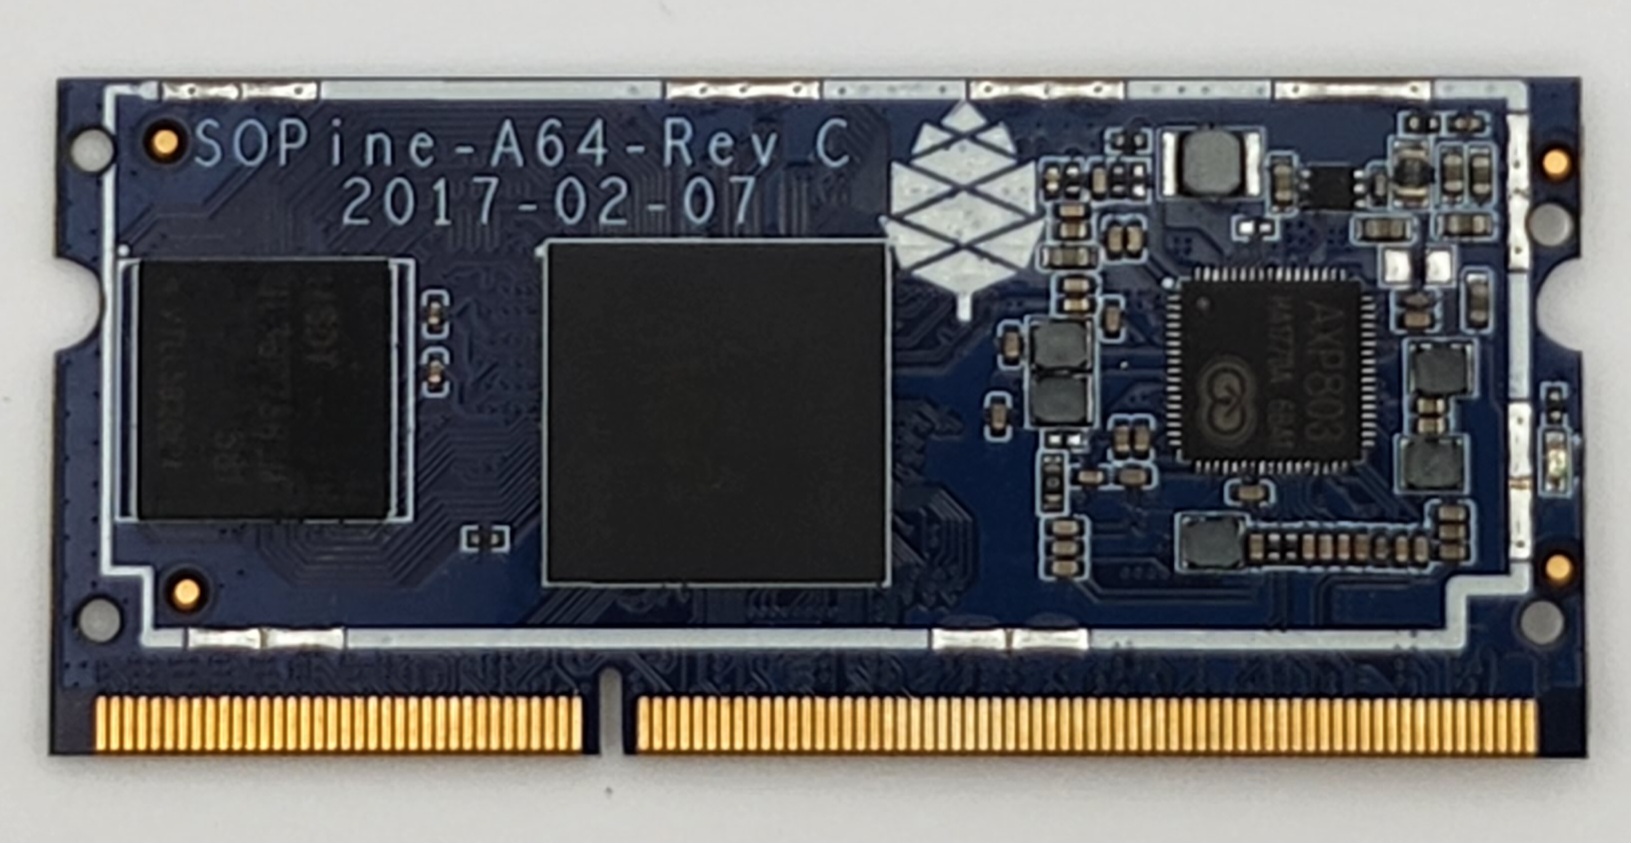
SOPINE + Baseboard
Also procured when I was on this “let’s buy random SBCs” kick. The Pine64 SOPINE is actually a compute module that comes in the form factor of a memory module.
Pine64 SOPINE Compute Module
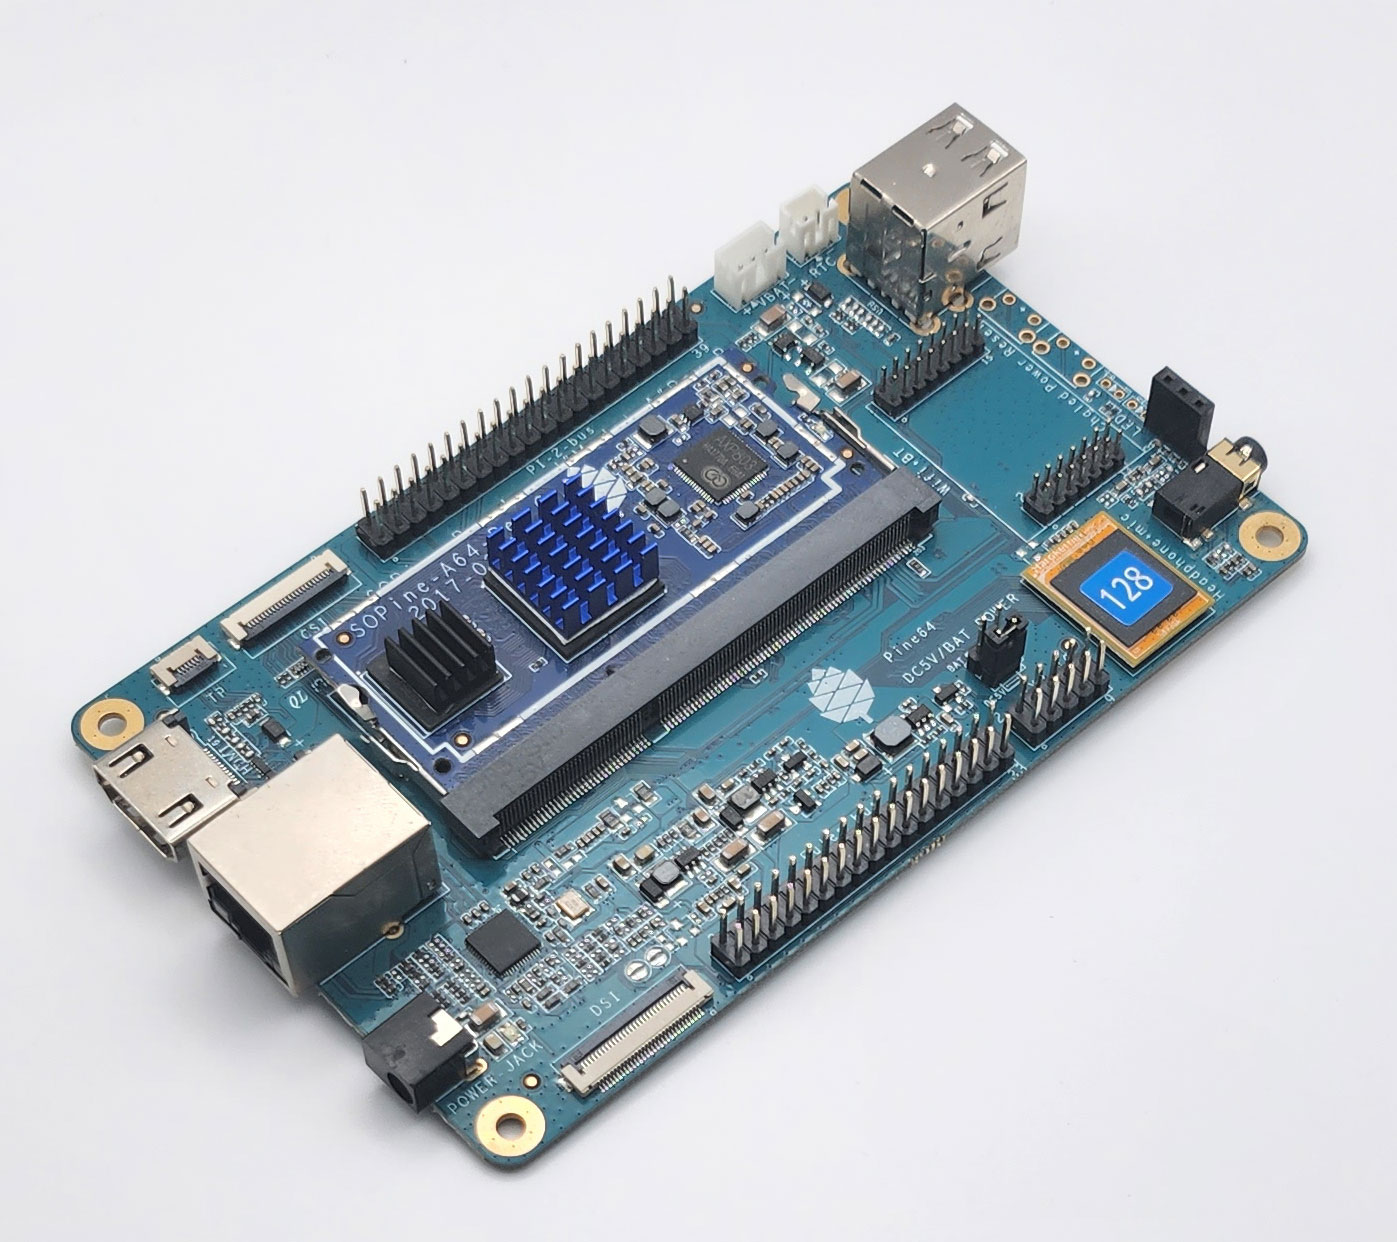
Back to using Allwinner SoCs. In order to make this thing useful, you need to place it in something. It’s possible to get a mini-ITX form factor board that can accommodate 7 of these modules. Before going to that extreme, there is this much simpler baseboard which can also use eMMC for storage.

Baseboard with SOPINE, eMMC, and heat sinks
I really need to find an appropriate case for this one as it currently performs its duty while sitting on an anti-static bag.
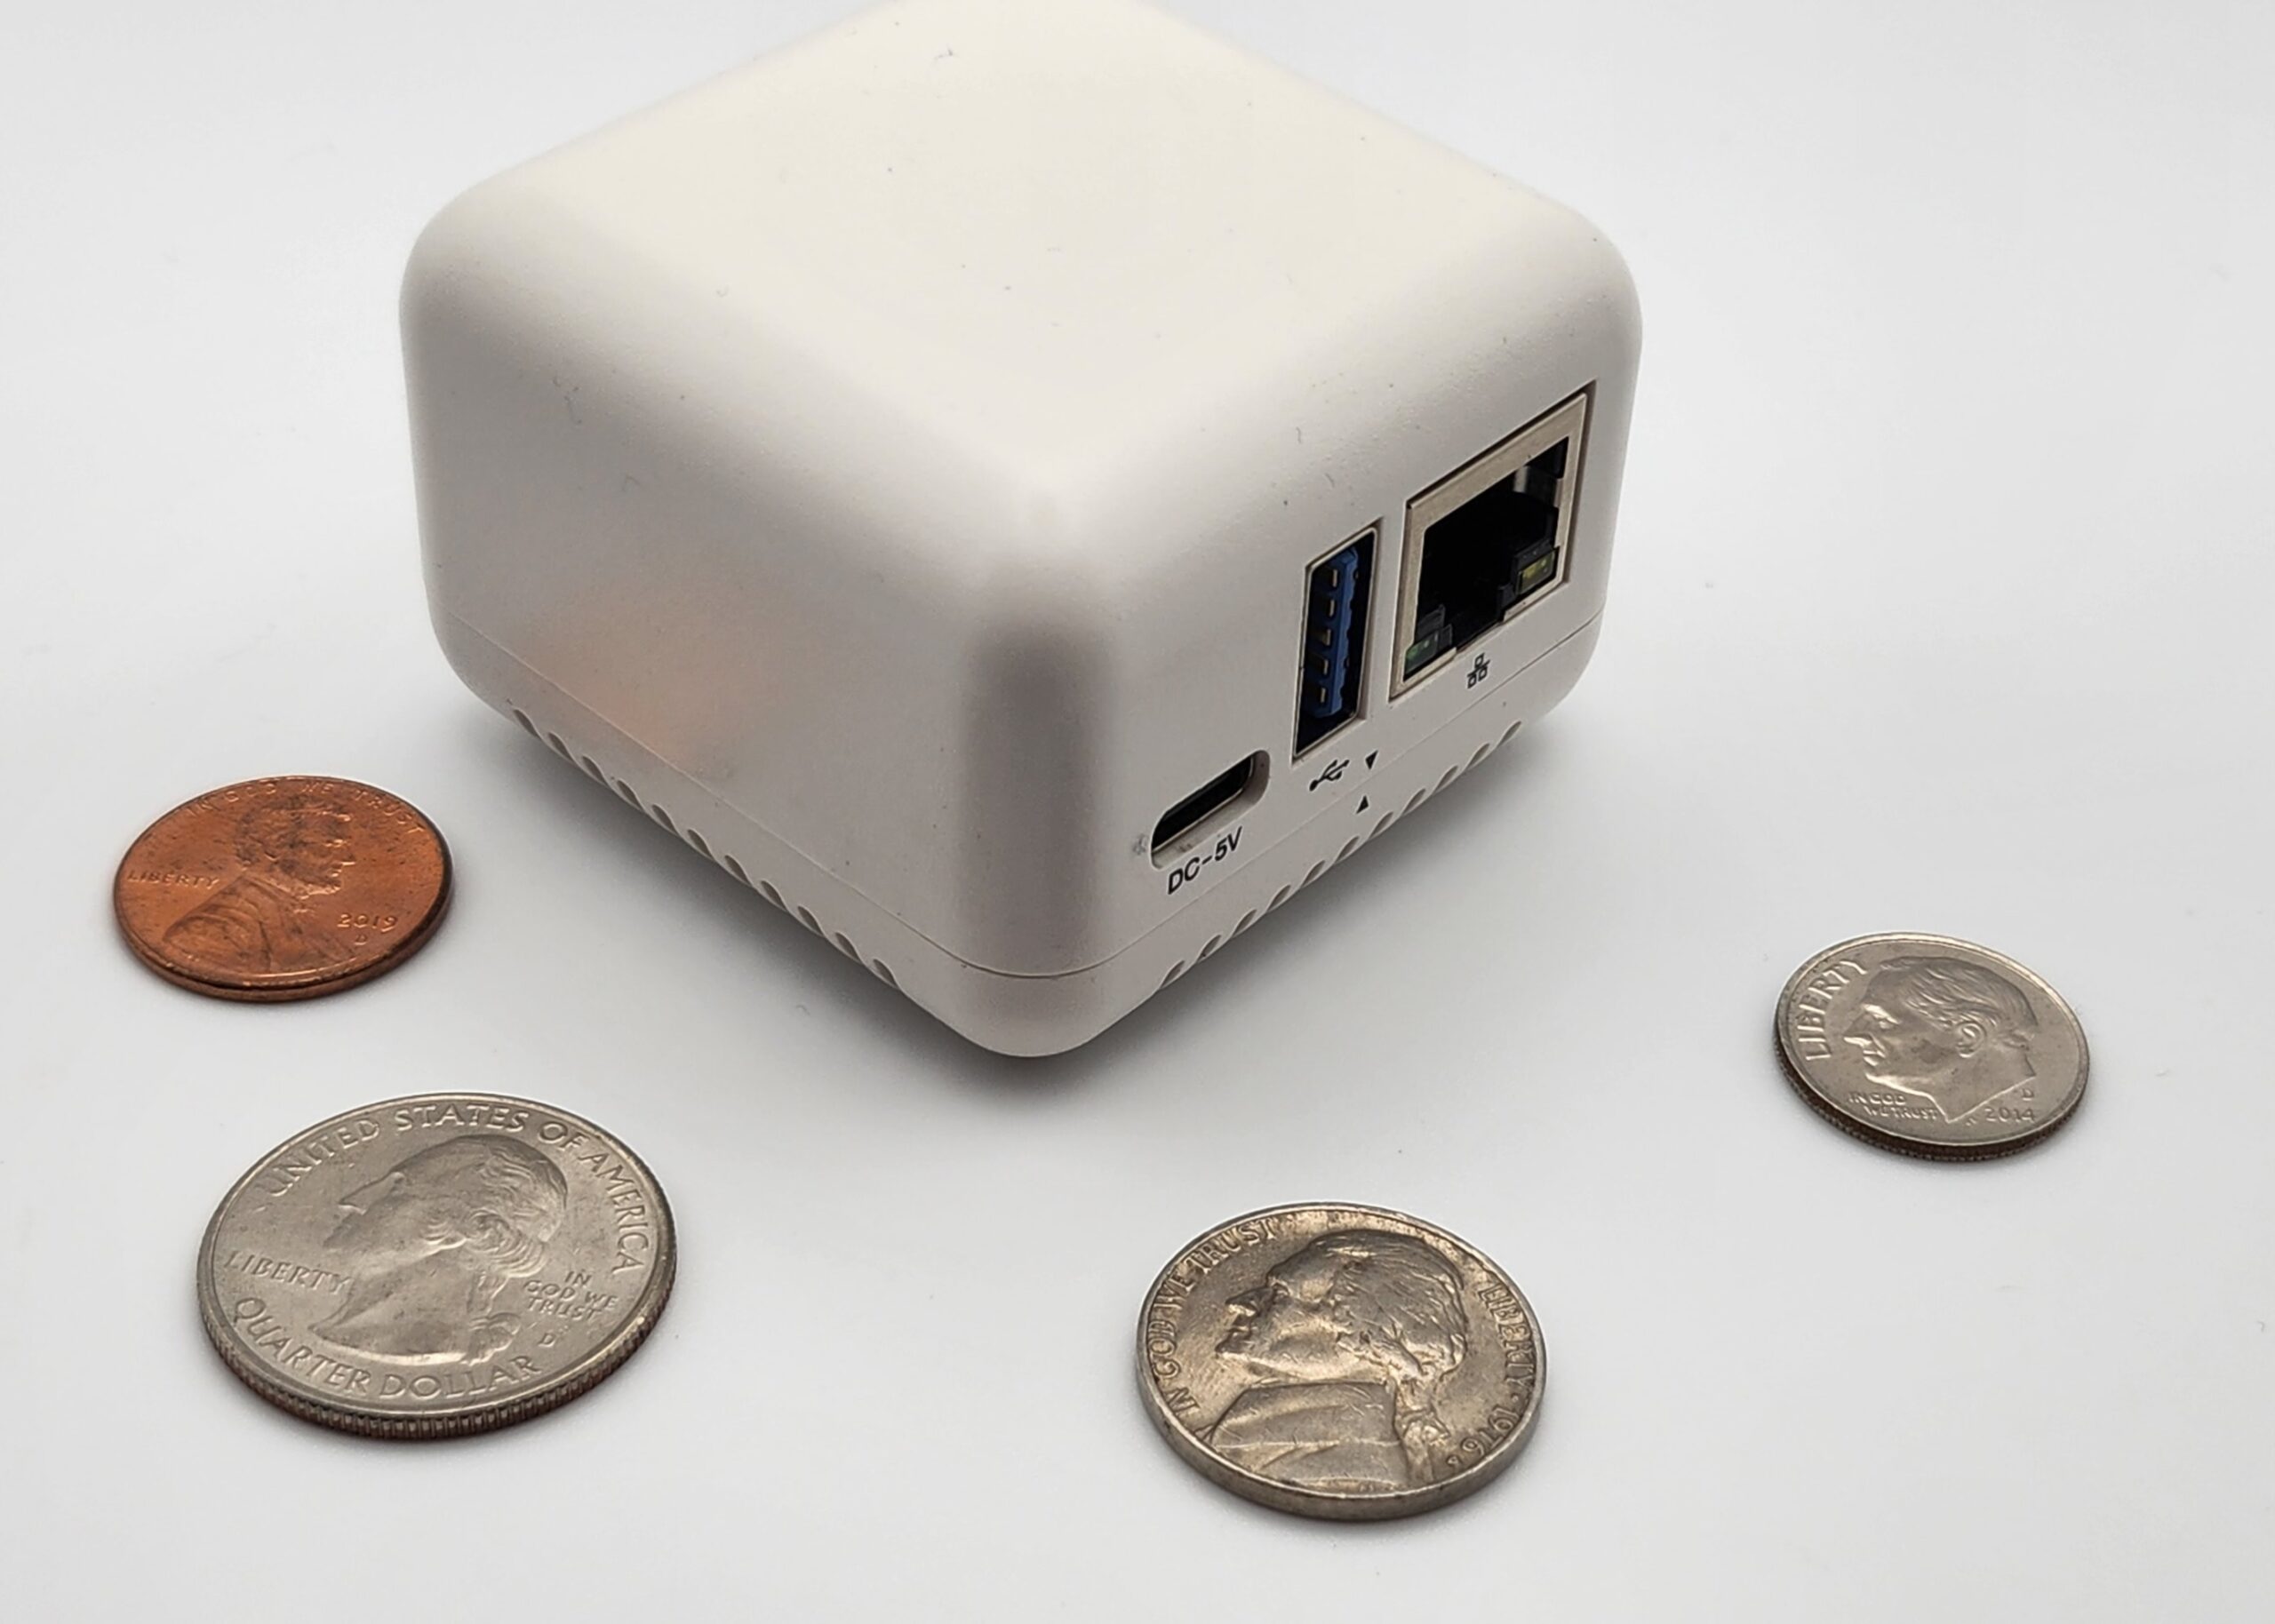
NanoPi NEO3
I enjoy running the DietPi distribution on many of these SBCs (as it’s developed not just for Raspberry Pi). I have also found their website to be a useful resource for discovering new SBCs. That’s how I found the NanoPi series and zeroed in on this NEO3 unit, sporting a Rockchip SoC, and photographed here with some American currency in order to illustrate its relative size :
NanoPi NEO3
I often forget about this computer because it’s off in another room, just quietly performing its assigned duty.
MangoPi MQ-Pro
So far, I’ve heard of these fruits prepending the Greek letter pi for naming small computing products :- Raspberry – the O.G.
- Banana – seems to be popular for hobbyist router/switches
- Orange
- Atomic
- Nano
- Mango
Okay, so the AtomicPi and NanoPi names don’t really make sense considering the fruit convention.
Anyway, the newest entry is the MangoPi. These showed up on Ameridroid a few months ago. There are 2 variants : the MQ-Pro and the MQ-Quad. I picked one and rolled with it.

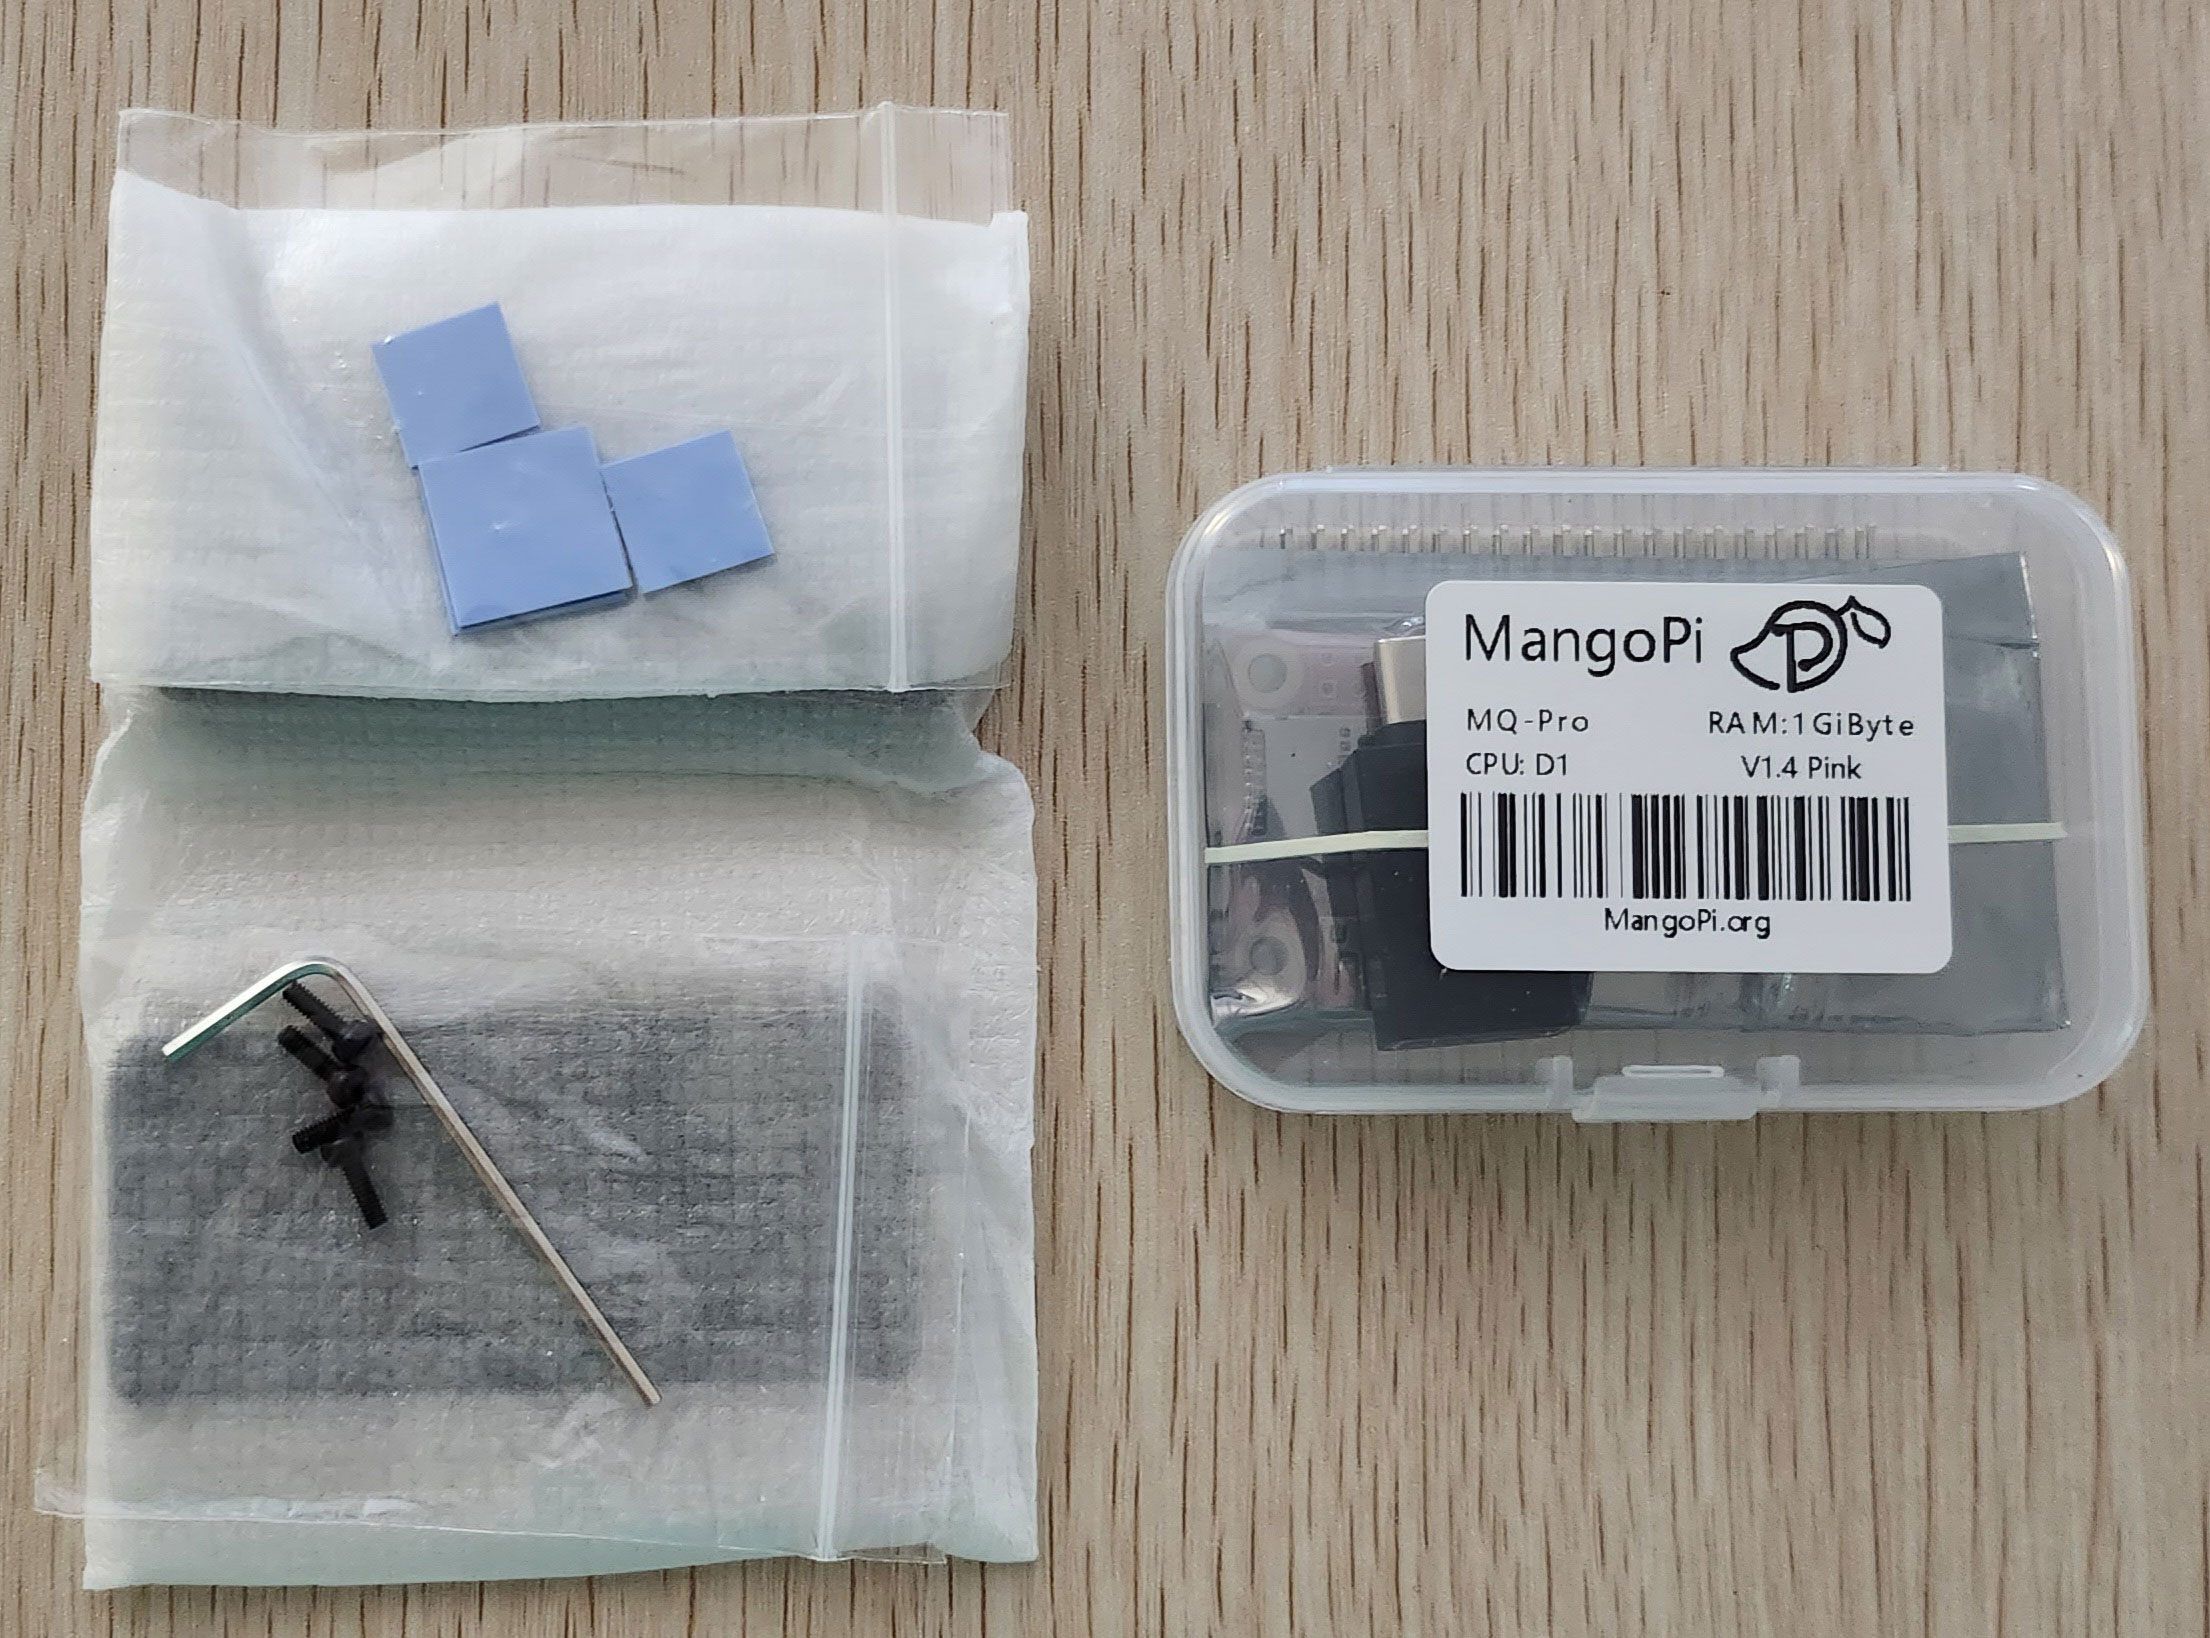
MangoPi MQ-Pro pieces arrive
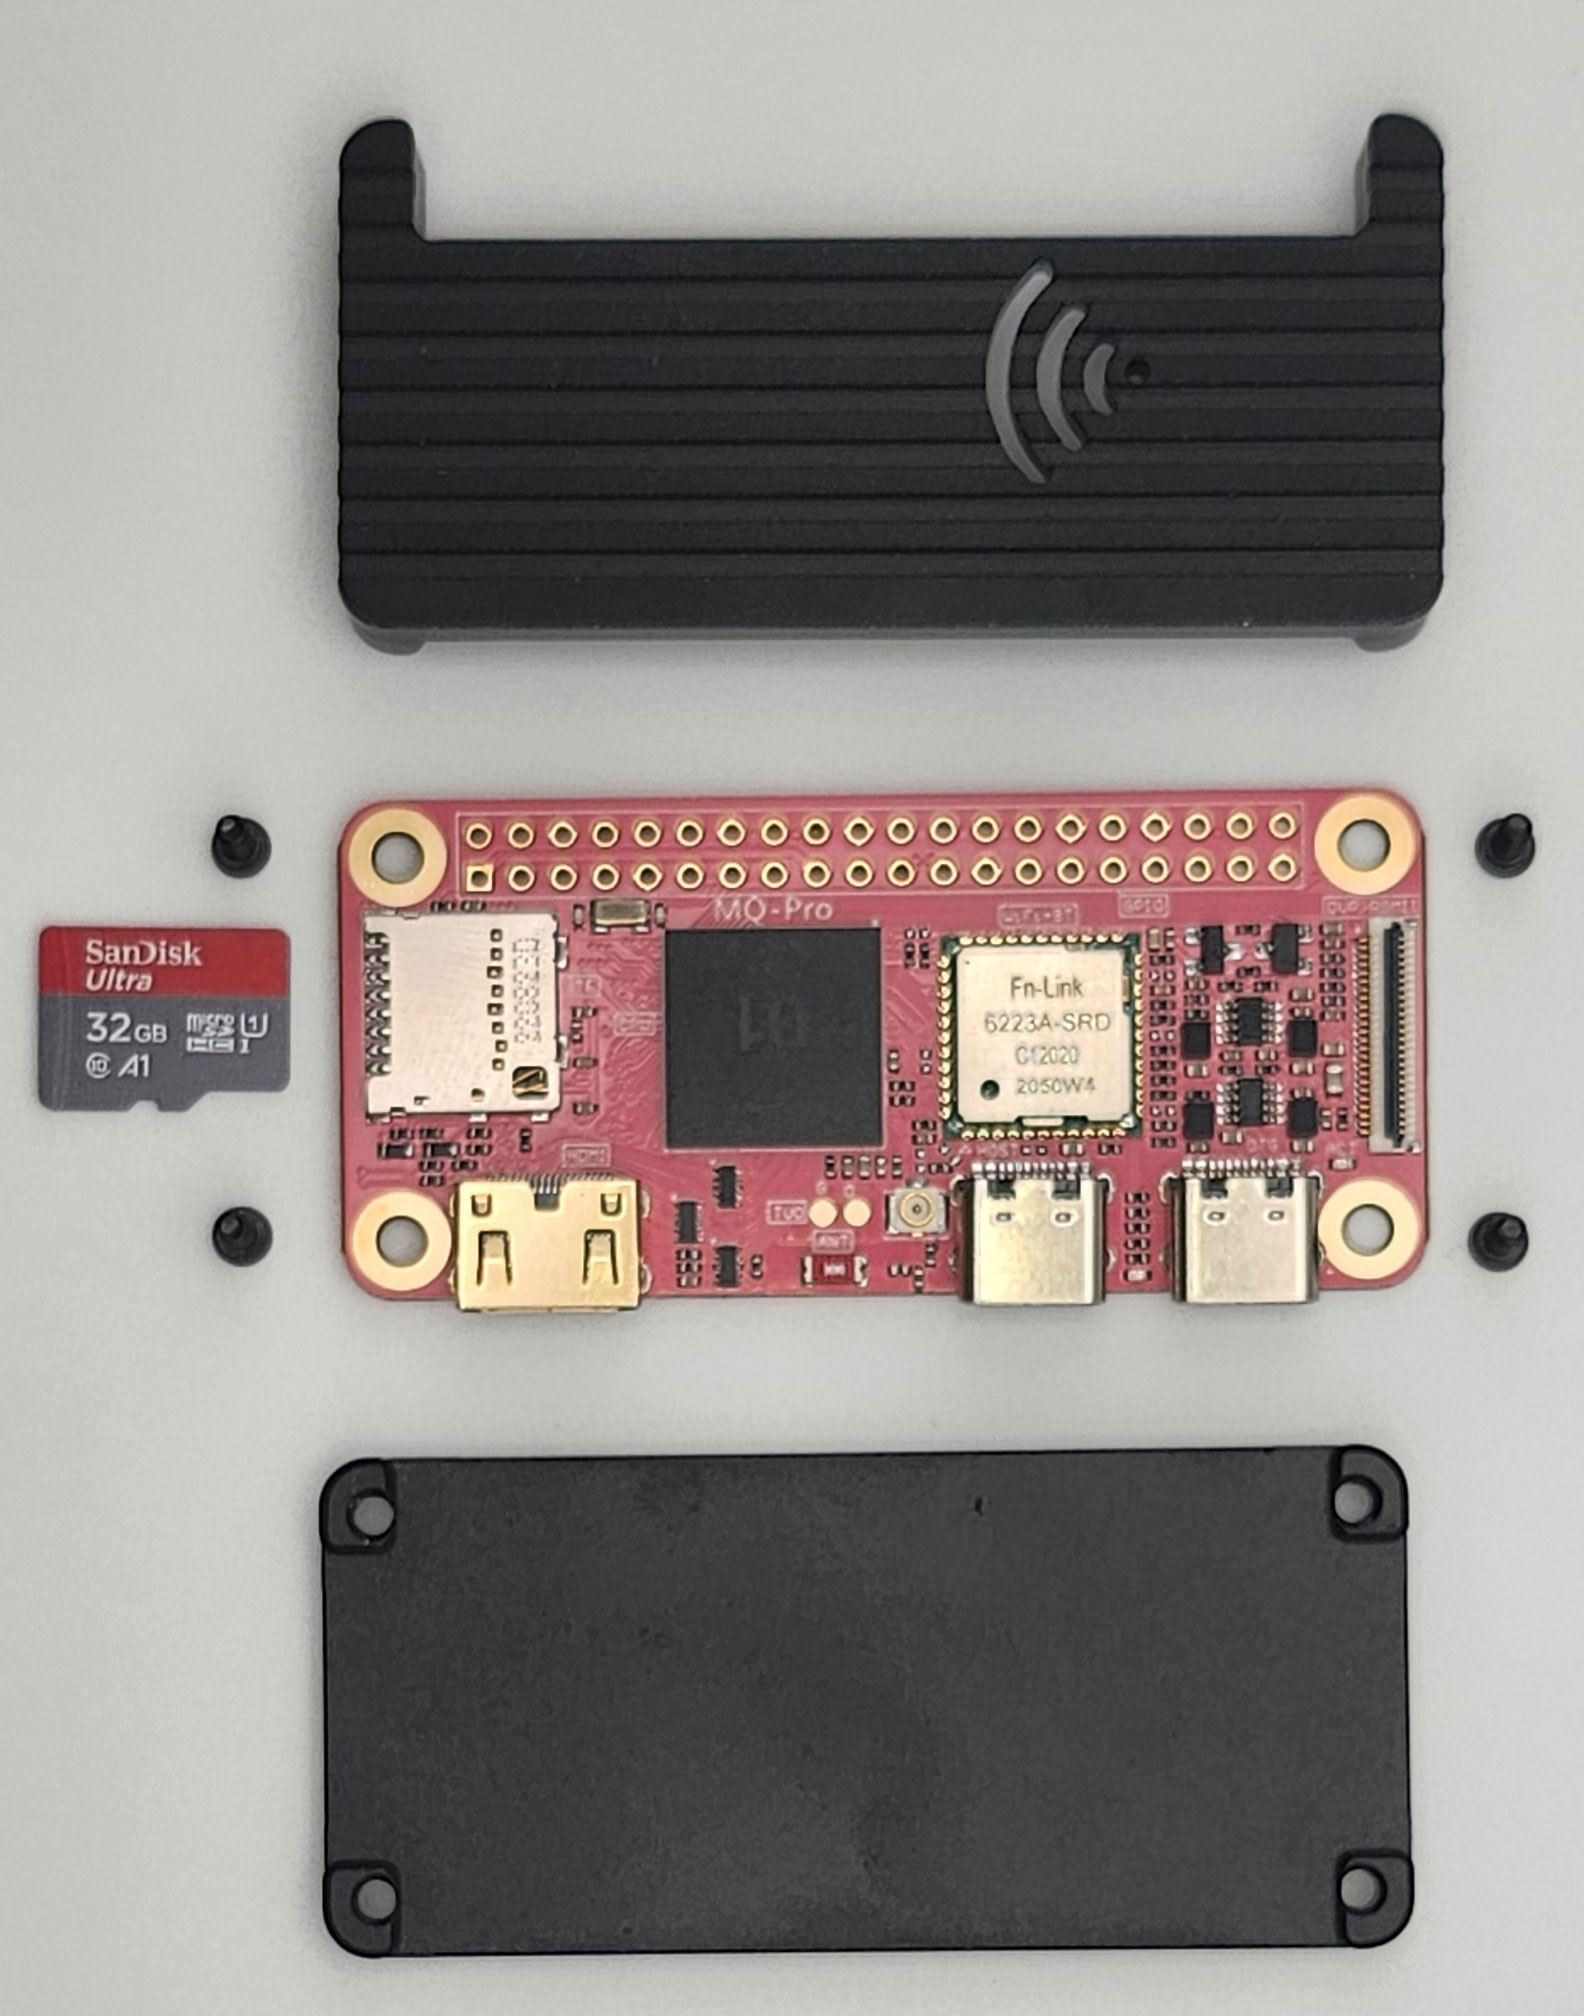
When it arrived, I unpacked it, assembled the pieces, downloaded a distro, tossed that on a micro-SD card, connected a monitor and keyboard to it via its USB-C port, got the distro up and running, configured the wireless networking with a static IP address and installed sshd, and it was ready to go as a headless server for an edge application.

MangoPi MQ-Pro components, ready for assembly
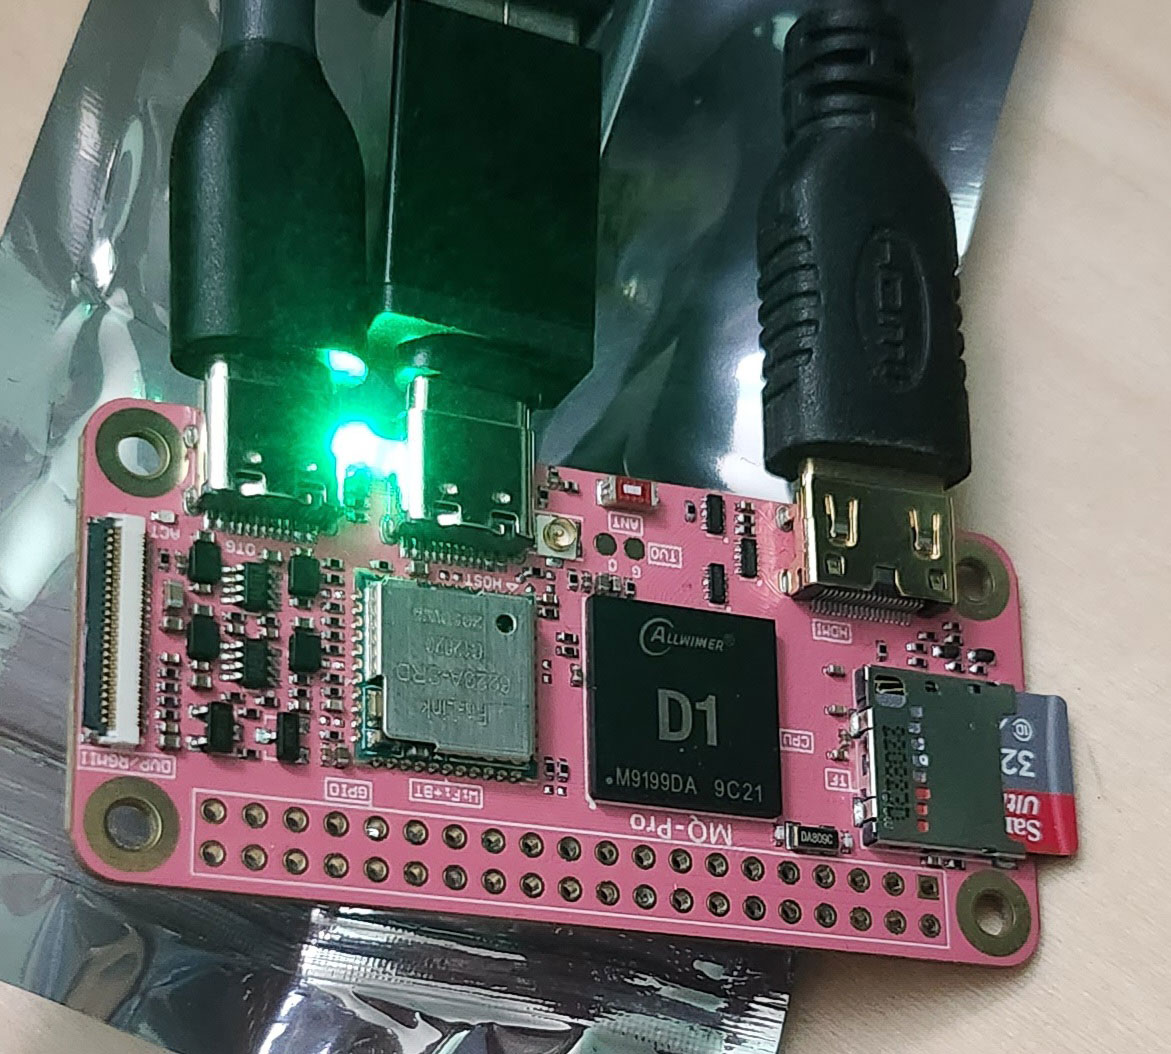
The unit came with no instructions that I can recall. After I got it set up, I remember thinking, “What is wrong with me ? Why is it that I just know how to do all of this without any documentation ?”

MangoPi MQ-Pro in first test
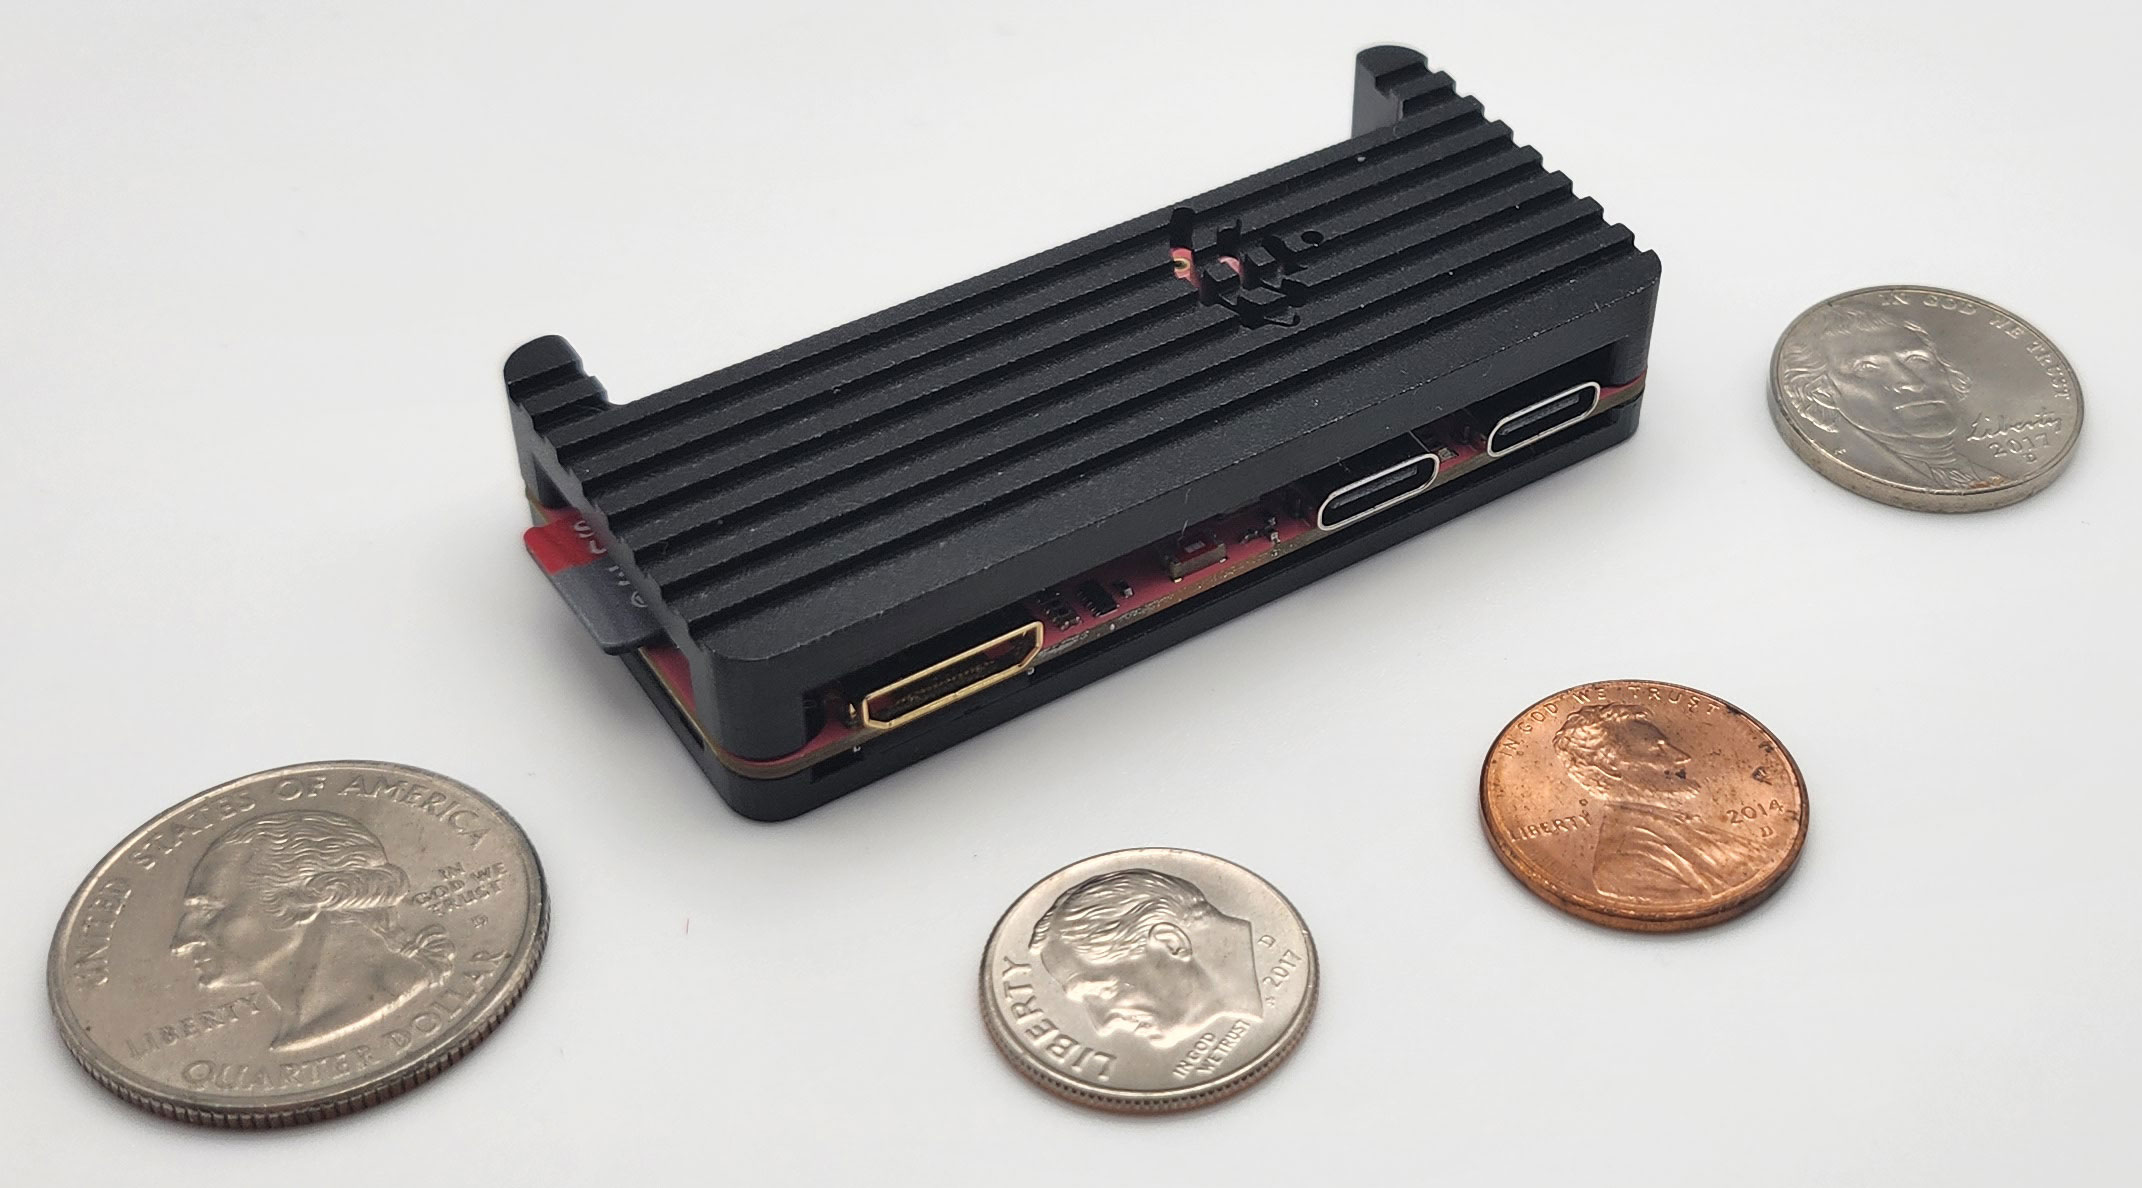
Only after I got it up and running and poked around a bit did I realize that this SBC doesn’t have an ARM SoC– it’s a RISC-V SoC. It uses the Allwinner D1, so it looks like I came full circle back to Allwinner.

MangoPi MQ-Pro with more US coinage for scale
So I now have my first piece of RISC-V hobbyist kit, although I learned recently from Kostya that it’s not that great for multimedia.
Handheld Gaming Units
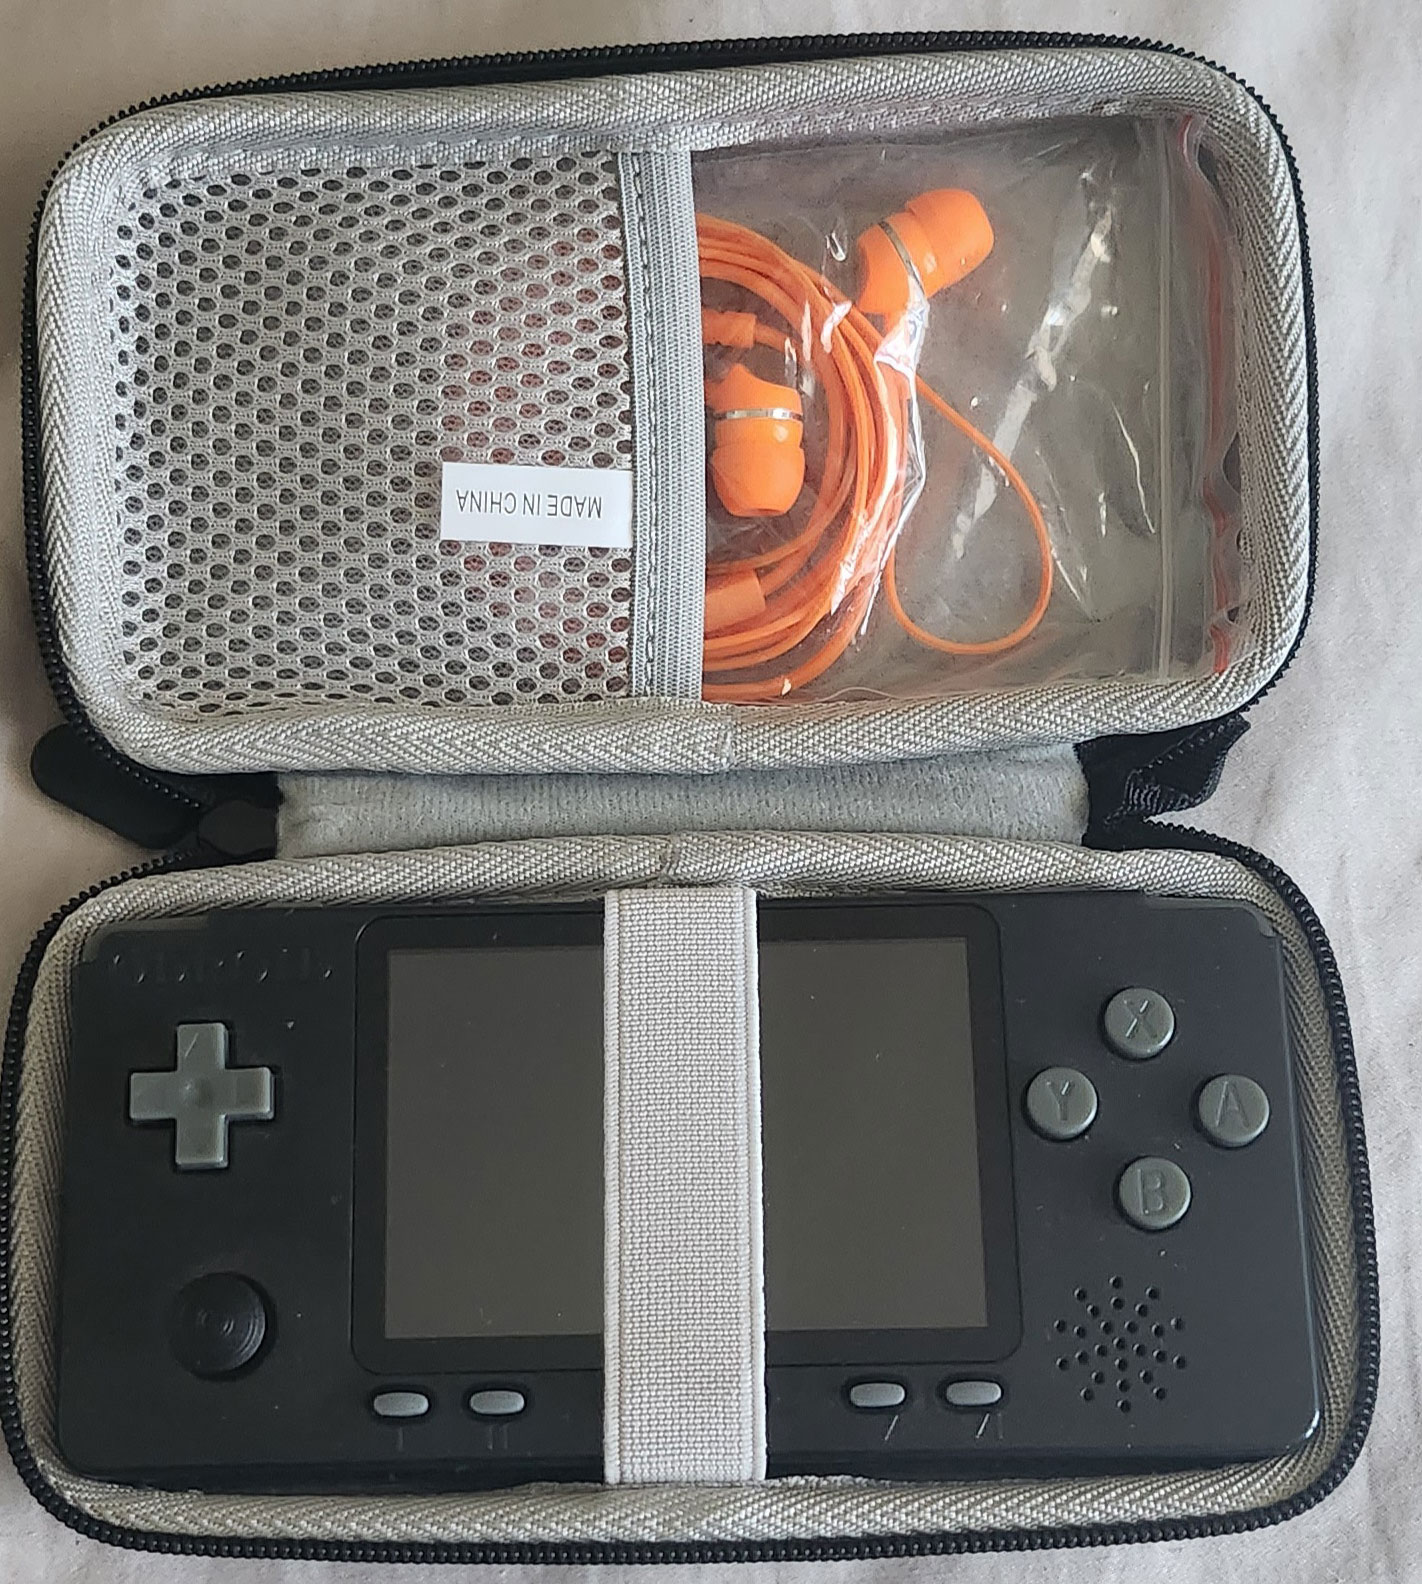
The folks at Hardkernel have also produced a series of handheld retro-gaming devices called ODROID-GO. The first one resembled the original Nintendo Game Boy, came as a kit to be assembled, and emulated 5 classic consoles. It also had some hackability to it. Quite a cool little device, and inexpensive too. I have since passed it along to another gaming enthusiast.Later came the ODROID-GO Advance, also a kit, but emulating more devices. I was extremely eager to get my hands on this since it could emulate SNES in addition to NES. It also features a headphone jack, unlike the earlier model. True to form, after I received mine, it took me about 13 months before I got around to assembling it. After that, the biggest challenge I had was trying to find an appropriate case for it.

ODROID-GO Advance with case and headphones
Even though it may try to copy the general aesthetic and form factor of the Game Boy Advance, cases for the GBA don’t fit this correctly.
Further, Hardkernel have also released the ODROID-GO Super and Ultra models that do more and more. The Advance, Super, and Ultra models have powerful SoCs and feature much more hackability than the first ODROID-GO model.
I know that the guts of the Advance have been used in other products as well. The same is likely true for the Super and Ultra.
Ultimately, the ODROID-GO Advance was just another project I assembled and then set aside since I like the idea of playing old games much more than actually doing it. Plus, the fact has finally crystalized in my mind over the past few years that I have never enjoyed handheld gaming and likely will never enjoy handheld gaming, even after I started wearing glasses. Not that I’m averse to old Game Boy / Color / Advance games, but if I’m going to play them, I’d rather emulate them on a large display.
The Future
In some of my weaker moments, I consider ordering up certain Banana Pi products (like the Banana Pi BPI-R2) with a case and doing my own router tricks using some open source router/firewall solution. And then I remind myself that my existing prosumer-type home router is doing just fine. But maybe one day…The post My SBC Collection first appeared on Breaking Eggs And Making Omelettes.