
Recherche avancée
Autres articles (13)
-
La sauvegarde automatique de canaux SPIP
1er avril 2010, par kent1Dans le cadre de la mise en place d’une plateforme ouverte, il est important pour les hébergeurs de pouvoir disposer de sauvegardes assez régulières pour parer à tout problème éventuel.
Pour réaliser cette tâche on se base sur deux plugins SPIP : Saveauto qui permet une sauvegarde régulière de la base de donnée sous la forme d’un dump mysql (utilisable dans phpmyadmin) mes_fichiers_2 qui permet de réaliser une archive au format zip des données importantes du site (les documents, les éléments (...) -
Submit bugs and patches
13 avril 2011Unfortunately a software is never perfect.
If you think you have found a bug, report it using our ticket system. Please to help us to fix it by providing the following information : the browser you are using, including the exact version as precise an explanation as possible of the problem if possible, the steps taken resulting in the problem a link to the site / page in question
If you think you have solved the bug, fill in a ticket and attach to it a corrective patch.
You may also (...) -
Les formats acceptés
28 janvier 2010, par kent1Les commandes suivantes permettent d’avoir des informations sur les formats et codecs gérés par l’installation local de ffmpeg :
ffmpeg -codecs ffmpeg -formats
Les format videos acceptés en entrée
Cette liste est non exhaustive, elle met en exergue les principaux formats utilisés : h264 : H.264 / AVC / MPEG-4 AVC / MPEG-4 part 10 m4v : raw MPEG-4 video format flv : Flash Video (FLV) / Sorenson Spark / Sorenson H.263 Theora wmv :
Les formats vidéos de sortie possibles
Dans un premier temps on (...)
Sur d’autres sites (5551)
-
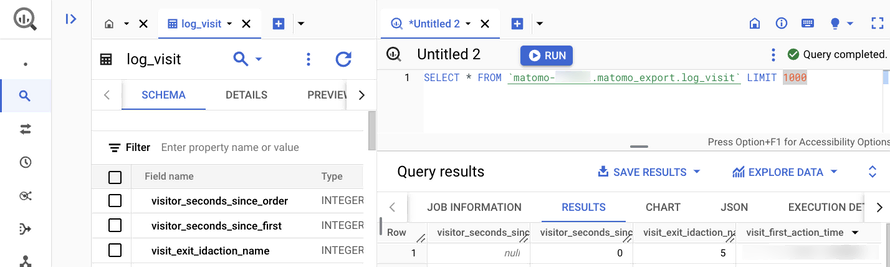
Introducing the BigQuery & Data Warehouse Export feature
30 janvier, par Matomo Core Team
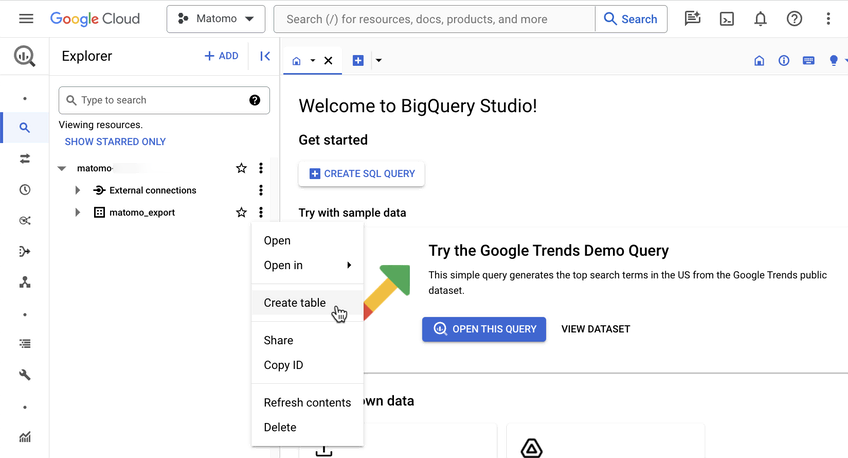
Matomo is built on a simple truth : your data belongs to you, and you should have complete control over it. That’s why we’re excited to launch our new BigQuery & Data Warehouse Export feature for Matomo Cloud, giving you even more ways to work with your analytics data.
Until now, getting raw data from Matomo Cloud required APIs and custom scripts, or waiting for engineering help.
Our new BigQuery & Data Warehouse Export feature removes those barriers. You can now access your raw, unaggregated data and schedule regular exports straight to your data warehouse.
The feature works with all major data warehouses including (but not limited to) :
- Google BigQuery
- Amazon Redshift
- Snowflake
- Azure Synapse Analytics
- Apache Hive
- Teradata
You can schedule exports, combine your Matomo data with other data sources in your data warehouse, and easily query data with SQL-like queries.
Direct raw data access for greater data portability
Waiting for engineering support can delay your work. Managing API connections and writing scripts can be time-consuming. This keeps you from focusing on what you do best—analysing data.
With the BigQuery & Data Warehouse Export feature, you get direct access to your raw Matomo data without the technical setup. So, you can spend more time analysing data and finding insights that matter.
Bringing your data together
Answering business questions often requires data from multiple sources. A single customer interaction might span your CRM, web analytics, sales systems, and more. Piecing this data together manually is time-consuming—what starts as a seemingly simple question from stakeholders can turn into hours of work collecting and comparing data across different tools.
This feature lets you combine your Matomo data with data from other business systems in your data warehouse. Instead of switching between tools or manually comparing spreadsheets, you can analyse all your data in one place to better understand how customers interact with your business.
Easy, custom analysis with SQL-like queries
Standard, pre-built reports often don’t address the specific, detailed questions that analysts need to answer.
When you use the BigQuery & Data Warehouse Export feature, you can use SQL-like queries in your data warehouse to do detailed, customised analysis. This flexibility allows you to explore your data in depth and uncover specific insights that aren’t possible with pre-built reports.
Here is an example of how you might use SQL-like query to compare the behaviours of paying vs. non-paying users :
<xmp>SELECT
custom_dimension_value AS user_type, -- Assuming 'user_type' is stored in a custom dimension
COUNT(*) AS total_visits,
AVG(visit_total_time) AS avg_duration,
SUM(conversion.revenue) AS total_spent
FROM
`your_project.your_dataset.matomo_log_visit` AS visit
LEFT JOIN
`your_project.your_dataset.matomo_log_conversion` AS conversion
ON
visit.idvisit = conversion.idvisit
GROUP BY
custom_dimension_value; </xmp>
This query helps you compare metrics such as the number of visits, average session duration, and total amount spent between paying and non-paying users. It provides a full view of behavioural differences between these groups.
Advanced data manipulation and visualisation
When you need to create detailed reports or dive deep into data analysis, working within the constraints of a fixed user interface (UI) can limit your ability to draw insights.
Exporting your Matomo data to a data warehouse like BigQuery provides greater flexibility for in-depth manipulation and advanced visualisations, enabling you to uncover deeper insights and tailor your reports more effectively.
Getting started
To set up data warehouse exports in your Matomo :
- Go to System Admin (cog icon in the top right corner)
- Select ‘Export’ from the left-hand menu
- Choose ‘BigQuery & Data Warehouse’
You’ll find detailed instructions in our data warehouse exports guide.
Please note, enabling this feature will cost an additional 10% of your current subscription. You can view the exact cost by following the steps above.
New to Matomo ? Start your 21-day free trial now (no credit card required), or request a demo.
Try Matomo for Free
21 day free trial. No credit card required.
-
Is Google Analytics Accurate ? 6 Important Caveats
8 novembre 2022, par ErinIt’s no secret that accurate website analytics is crucial for growing your online business — and Google Analytics is often the go-to source for insights.
But is Google Analytics data accurate ? Can you fully trust the provided numbers ? Here’s a detailed explainer.
How Accurate is Google Analytics ? A Data-Backed Answer
When properly configured, Google Analytics (Universal Analytics and Google Analytics 4) is moderately accurate for global traffic collection. That said : Google Analytics doesn’t accurately report European traffic.
According to GDPR provisions, sites using GA products must display a cookie consent banner. This consent is required to collect third-party cookies — a tracking mechanism for identifying users across web properties.
Google Analytics (GA) cannot process data about the user’s visit if they rejected cookies. In such cases, your analytics reports will be incomplete.
Cookie rejection refers to visitors declining or blocking cookies from ever being collected by a specific website (or within their browser). It immediately affects the accuracy of all metrics in Google Analytics.
Google Analytics is not accurate in locations where cookie consent to tracking is legally required. Most consumers don’t like disruptive cookie banners or harbour concerns about their privacy — and chose to reject tracking.
This leaves businesses with incomplete data, which, in turn, results in :
- Lower traffic counts as you’re not collecting 100% of the visitor data.
- Loss of website optimisation capabilities. You can’t make data-backed decisions due to inconsistent reporting
For the above reasons, many companies now consider cookieless website tracking apps that don’t require consent screen displays.
Why is Google Analytics Not Accurate ? 6 Causes and Solutions
A high rejection rate of cookie banners is the main reason for inaccurate Google Analytics reporting. In addition, your account settings can also hinder Google Analytics’ accuracy.
If your analytics data looks wonky, check for these six Google Analytics accuracy problems.
You Need to Secure Consent to Cookies Collection
To be GDPR-compliant, you must display a cookie consent screen to all European users. Likewise, other jurisdictions and industries require similar measures for user data collection.
This is a nuisance for many businesses since cookie rejection undermines their remarketing capabilities. Hence, some try to maximise cookie acceptance rates with dark patterns. For example : hide the option to decline tracking or make the texts too small.
Banner on the left doesn’t provide an evident option to reject all cookies and nudges the user to accept tracking. Banner on the right does a better job explaining the purpose of data collection and offers a straightforward yes/no selection Sadly, not everyone’s treating users with respect. A joint study by German and American researchers found that only 11% of US websites (from a sample of 5,000+) use GDPR-compliant cookie banners.
As a result, many users aren’t aware of the background data collection to which they have (or have not) given consent. Another analysis of 200,000 cookies discovered that 70% of third-party marketing cookies transfer user data outside of the EU — a practice in breach of GDPR.
Naturally, data regulators and activities are after this issue. In April 2022, Google was pressured to introduce a ‘reject all’ cookies button to all of its products (a €150 million compliance fine likely helped with that). Whereas, noyb has lodged over 220 complaints against individual websites with deceptive cookie consent banners.
The takeaway ? Messing up with the cookie consent mechanism can get you in legal trouble. Don’t use sneaky banners as there are better ways to collect website traffic statistics.
Solution : Try Matomo GDPR-Friendly Analytics
Fill in the gaps in your traffic analytics with Matomo – a fully GDPR-compliant product that doesn’t rely on third-party cookies for tracking web visitors. Because of how it is designed, the French data protection authority (CNIL) confirmed that Matomo can be used to collect data without tracking consent.
With Matomo, you can track website users without asking for cookie consent. And when you do, we supply you with a compact, compliant, non-disruptive cookie banner design.
Your Google Tag Isn’t Embedded Correctly
Google Tag (gtag.js) is a web tracking script that sends data to your Google Analytics, Google Ads and Google Marketing Platform.
A corrupted gtag.js installation can create two accuracy issues :
- Duplicate page tracking
- Missing script installation
Is there a way to tell if you’re affected ?
Yes. You may have duplicate scripts installed if you have a very low bounce rate on most website pages (below 15% – 20%). The above can happen if you’re using a WordPress GA plugin and additionally embed gtag.js straight in your website code.
A tell-tale sign of a missing script on some pages is low/no traffic stats. Google alerts you about this with a banner :
Solution : Use Available Troubleshooting Tools
Use Google Analytics Debugger extension to analyse pages with low bounce rates. Use the search bar to locate duplicate code-tracking elements.
Alternatively, you can use Google Tag Assistant for diagnosing snippet install and troubleshooting issues on individual pages.
If the above didn’t work, re-install your analytics script.
Machine Learning and Blended Data Are Applied
Google Analytics 4 (GA4) relies a lot on machine learning and algorithmic predictions.
By applying Google’s advanced machine learning models, the new Analytics can automatically alert you to significant trends in your data. [...] For example, it calculates churn probability so you can more efficiently invest in retaining customers.
On the surface, the above sounds exciting. In practice, Google’s application of predictive algorithms means you’re not seeing actual data.
To offer a variation of cookieless tracking, Google algorithms close the gaps in reporting by creating models (i.e., data-backed predictions) instead of reporting on actual user behaviours. Therefore, your GA4 numbers may not be accurate.
For bigger web properties (think websites with 1+ million users), Google also relies on data sampling — a practice of extrapolating data analytics, based on a data subset, rather than the entire dataset. Once again, this can lead to inconsistencies in reporting with some numbers (e.g., average conversion rates) being inflated or downplayed.
Solution : Try an Alternative Website Analytics App
Unlike GA4, Matomo reports consist of 100% unsampled data. All the aggregated reporting you see is based on real user data (not guesstimation).
Moreover, you can migrate from Universal Analytics (UA) to Matomo without losing access to your historical records. GA4 doesn’t yet have any backward compatibility.
Spam and Bot Traffic Isn’t Filtered Out
Surprise ! 42% of all Internet traffic is generated by bots, of which 27.7% are bad ones.
Good bots (aka crawlers) do essential web “housekeeping” tasks like indexing web pages. Bad bots distribute malware, spam contact forms, hack user accounts and do other nasty stuff.
A lot of such spam bots are designed specifically for web analytics apps. The goal ? Flood your dashboard with bogus data in hopes of getting some return action from your side.
Types of Google Analytics Spam :
- Referral spam. Spambots hijack the referrer, displayed in your GA referral traffic report to indicate a page visit from some random website (which didn’t actually occur).
- Event spam. Bots generate fake events with free language entries enticing you to visit their website.
- Ghost traffic spam. Malicious parties can also inject fake pageviews, containing URLs that they want you to click.
Obviously, such spammy entities distort the real website analytics numbers.
Solution : Set Up Bot/Spam Filters
Google Analytics 4 has automatic filtering of bot traffic enabled for all tracked Web and App properties.
But if you’re using Universal Analytics, you’ll have to manually configure spam filtering. First, create a new view and then set up a custom filter. Program it to exclude :
- Filter Field : Request URI
- Filter Pattern : Bot traffic URL
Once you’ve configured everything, validate the results using Verify this filter feature. Then repeat the process for other fishy URLs, hostnames and IP addresses.
You Don’t Filter Internal Traffic
Your team(s) spend a lot of time on your website — and their sporadic behaviours can impair your traffic counts and other website metrics.
To keep your data “employee-free”, exclude traffic from :
- Your corporate IPs addresses
- Known personal IPs of employees (for remote workers)
If you also have a separate stage version of your website, you should also filter out all traffic coming from it. Your developers, contractors and marketing people spend a lot of time fiddling with your website. This can cause a big discrepancy in average time on page and engagement rates.
Solution : Set Internal Traffic Filters
Google provides instructions for excluding internal traffic from your reports using IPv4/IPv6 address filters.
Session Timeouts After 30 Minutes
After 30 minutes of inactivity, Google Analytics tracking sessions start over. Inactivity means no recorded interaction hits during this time.
Session timeouts can be a problem for some websites as users often pin a tab to check it back later. Because of this, you can count the same user twice or more — and this leads to skewed reporting.
Solution : Programme Custom Timeout Sessions
You can codify custom cookie timeout sessions with the following code snippets :
- _setSessionCookieTimeout. Set a custom new session cookie timeout in milliseconds.
- _setVisitorCookieTimeout. Sets a custom Google Analytics visitor cookie expiration time frame in milliseconds.
Final Thoughts
Thanks to its scale and longevity, Google Analytics has some strong sides, but its data accuracy isn’t 100% perfect.
The inability to capture analytics data from users who don’t consent to cookie tracking and data sampling applied to bigger web properties may be a deal-breaker for your business.
If that’s the case, try Matomo — a GDPR-compliant, accurate web analytics solution. Start your 21-day free trial now. No credit card required.
21 day free trial. No credit card required.
-
Organic Traffic : What It Is and How to Increase It
19 septembre 2023, par Erin — Analytics TipsOrganic traffic can be a website’s most valuable source of visitors. But it can also be the hardest form of traffic to acquire. While paid ads can generate traffic almost instantly, you need to invest time and energy into growing traffic from search engines.
And it all starts with understanding exactly what organic traffic is.
If you want to understand what organic traffic is, how to measure it and how to generate more of it, then this article is for you.
What is organic traffic ?
Organic traffic is the visitors your website receives from the unpaid results on search engines like Google, Bing and DuckDuckGo.
The higher your website ranks in the search engine results pages and the more search terms your website ranks for, the more organic traffic your site will receive.
Organic traffic is highly valued by marketers, partly because it has a much higher clickthrough rate than PPC ads. Research shows the top organic result has a 39.8% CTR compared to just 2.1% for paid ads.
So, while you can pay to appear at the top of search engines (using a platform like Google Ads, for instance), you probably won’t receive as much traffic as you would if you were to rank organically in the same search engine.
What other types of traffic are there ?
Organic traffic isn’t the only type of traffic your website can get. You can also receive traffic from the following channels :
Direct
People familiar with your site may visit it directly, either by entering your URL into their browser or accessing it through a bookmarked link ; both scenarios are counted as direct traffic.
Social
Social traffic includes visits to your website from a social media platform. For example, if someone shares a link to your website on Facebook, any user who clicks on it will be counted as social traffic.
Websites
Social media isn’t the only way for someone to share a link to your website. Any time a visitor finds your website by clicking on a link on another website, it will be counted as “websites”. This is also known as referral traffic on some analytics platforms.
Campaign
Campaign traffic encompasses both paid and unpaid traffic sources. Paid sources include advertising on search engines and social media (also known as PPC or pay-per-click), as well as collaborations with influencers and sponsorships. Unpaid sources, such as your organisation’s email newsletters, cross-promotions with other businesses and other similar methods, are also part of this mix.
In simpler terms, it’s the traffic you deliberately direct to your site, and you utilise campaign tracking URLs to measure how these efforts impact your ROI.
A word on multi-touch attribution
If you are interested in learning more about types of traffic to track conversions, then it’s important to understand multi-touch attribution. The truth is most customers won’t just use a single traffic channel to find your website. In reality, the modern customer journey has multiple touchpoints, and customers may first find your site through an ad and then search for more about your brand on Google before going directly to your website.
You are at risk of under or overestimating the effectiveness of a marketing channel without using multi-touch attribution tracking. With this marketing analytics model, you can accurately weigh the impact of every channel and allocate budgets accordingly.
What are the benefits of organic traffic ?
Getting more organic traffic is a common marketing goal for many companies. And it’s not surprising why. There’s a lot to love about organic traffic.
For starters, it’s arguably the most cost-effective traffic your site can receive. You will still need to pay to create and distribute organic content (whether it’s a blog post or product page). You don’t need to pay for it to show up in a search engine. You continue to get value from organic traffic long after you’ve created the page, too. A good piece of organic content can receive high volumes of monthly visitors for years. That’s a stark difference from paid ads, where traffic stops as soon as you turn off the ad.
It also puts your website in front of a massive audience, with Google alone processing over 3.5 billion searches every day. There’s a good chance that if your target audience is looking for a solution to their problems, they start with Google.
Organic traffic is fantastic at building brand awareness. Usually, users aren’t searching for a specific brand or company. They are searching for informational keywords (“how to brew the perfect cup of coffee”) or unbranded transactional keywords (“best home workout machine”). In both cases, customers can use search engines to become aware of your brand.
Finally, organic traffic brings in high-quality leads at every marketing funnel stage. Because users are searching for informational and transactional keywords, your site can receive visits from buyers at every stage of the marketing funnel, giving you multiple chances to convert them and helping to increase the number of touch points you have.
How to check your website’s organic traffic
You don’t need to complete complex calculations to determine your site’s organic traffic. A web analytics solution like Matomo will accurately measure your site’s organic traffic.
In Matomo, on the left-hand sidebar, you can access organic traffic data by clicking Acquisition and then selecting All Channels.
You’ll find a detailed breakdown of all traffic sources, including organic traffic, within the specified timeframe. The report is set to the current day by default, but you can view organic traffic metrics over a day, week, month, year or a date range of your choice.
If you want to take things further, you can get a detailed view of organic visitors by creating a custom report for “Visitors from Search Engines only.” By creating a custom report with the segment “Channel Type is search”, you’ll be able to combine other metrics like average actions per visit, bounce rate, goal conversions, etc., to create a comprehensive report on your organic traffic and the behavior of these visitors.
Matomo also lets you integrate Google, Bing and Yahoo search consoles directly into your Matomo Analytics to monitor keyword performance.
How to increase organic traffic
Follow these six tips if you want to increase the web traffic you get organically from search engines.
Create more and better content
Here’s the reality : Most websites don’t get much traffic from Google. Only 40% of sites rank on the first page, and just 23% sit in the top three results.
Let’s take quality first. The best content tends to rise to the top of search engines. That’s because it gets shared more, receives more backlinks and gets more user engagement. So, if you want to appear at the top of Google results, creating mediocre content probably won’t cut it. You need to go above and beyond what is already there.
But you can’t just create one fantastic piece of content and expect to receive thousands of visitors. You need multiple pages targeting as many search terms as possible. The more pages search engines index, the more opportunities you have to rank. Or, to put it another way, the more shots you take, the greater your chances of scoring.
Use keyword research tools
While creating great content is essential, you want to ensure that content targets the right keywords. These keywords receive a suitable amount of traffic and are easy to rank for.
Keyword research tools like Ahrefs of Semrush are the easiest way to find high-traffic topics to write about. Specifically, you want to aim for long-tail keywords. These are search terms that contain three or more words. Think “Nike men’s basketball shoe” rather than “basketball shoe.”
As you can see, long tail keywords have a lower monthly search volume (250 vs. 1,100 using the example above) than broad terms but are much easier to rank for (14 vs. 41 Keyword Difficulty).
While the above tools can help you find new topics to write about, Matomo’s Search Engine Keywords Performance plugin can help highlight topics you have already covered that could be expanded.
The plugin automatically connects to APIs from all significant search engines and imports all the keywords people search for when clicking on your websites into your Matomo report.
If you find a cluster of keywords on the same topic that generates a lot of visitors, it may be worth creating even more content on that topic. Similarly, if there’s a topic you think you have covered but isn’t generating much traffic, you can look at revising and refreshing your existing content to try to rank higher.
Build high-quality backlinks
Backlinks are arguably the most important Google ranking factor and the primary way Google assesses the authoritativeness of your site and content. Backlinks strongly and positively correlate with traffic — at least according to 67.5% of respondents in a uSERP industry survey.
There are plenty of ways you can create high-quality backlinks that Google loves. Strategies include :
- Creating and promoting the best content about a given topic
- Guest posting on high-authority websites
- Building relationships with other websites
Ensure you avoid building low-quality spam links at all costs — such as private blog networks (PBNs), forum and comment spam links and directory links. These links won’t help your content to rank higher, and Google may even penalise your entire site if you build them.
Find and fix any technical Search Engine Optimisation (SEO) issues
Search engines like Google need to be able to quickly and accurately crawl and index your website to rank your content. Unfortunately, many sites suffer from technical issues that impede search engine bots.
The good news is that certain tools make these issues easy to spot. Take the Matomo SEO Web Vitals feature, for instance. This lets you track a set of core web vital metrics, including :
- Page Speed Score
- First Contentful Paint (FCP)
- Final Input Delay (FID)
- Last Contentful Paint (LCP)
- Cumulative Layout Shift (CLS)
Take things even further by identifying major bugs and issues with your site. Crashes and other issues that impact user experience can also hurt your SEO and organic traffic efforts — so it’s best to eliminate them as soon as they occur.
Use Matomo’s Crash Analytics feature to get precise bug location information as well as the user’s interactions that triggered, the device they were using, etc. Scheduled reporting and alerts allow you to automate this task and instantly detect bugs as soon as they occur.
Improve your on-page SEO
As well as fixing technical issues, you should spend time optimising specific elements of your website to improve how it ranks in search engines.
There are several on-page elements you should optimise :
- Image alt tags
- URLs
- Headings
- Title tags
- Internal links
Your goal should be to include a target keyword in each element above. For example, your URL should be something like yoursite.com/keyword.
It’s best to err on the side of caution here. Avoid adding too many keywords to each of these elements. This is called keyword stuffing, and Google may slap your site with a penalty.
Track your content’s performance
One final way to increase organic traffic is to use an analytics platform to understand what content needs improving and which pages can be removed.
Use an analytics platform like Matomo to see which pages generate the most organic traffic and which lag behind. This can help you prioritise your SEO efforts while highlighting pages that add no value. These pages can be completely revamped, redirected to another page or removed if appropriate.
Conclusion
Organic traffic is arguably the most valuable traffic source your site can acquire. It is essential to monitor organic traffic levels and take steps to increase your organic traffic.
A good analytics platform can help you do both. Matomo’s powerful, open-source web analytics solution protects your data and your users’ privacy, while providing the SEO tools you need to send your organic traffic levels soaring.
Start a free 21-day trial now, no credit card required.