Recherche avancée

Médias (1)

Mot : - Tags -/wave

Autres articles (82)

  • Qu’est ce qu’un masque de formulaire

    13 juin 2013, par

    Un masque de formulaire consiste en la personnalisation du formulaire de mise en ligne des médias, rubriques, actualités, éditoriaux et liens vers des sites.
    Chaque formulaire de publication d’objet peut donc être personnalisé.
    Pour accéder à la personnalisation des champs de formulaires, il est nécessaire d’aller dans l’administration de votre MediaSPIP puis de sélectionner "Configuration des masques de formulaires".
    Sélectionnez ensuite le formulaire à modifier en cliquant sur sont type d’objet. (...)

  • MediaSPIP v0.2

    21 juin 2013, par

    MediaSPIP 0.2 is the first MediaSPIP stable release.
    Its official release date is June 21, 2013 and is announced here.
    The zip file provided here only contains the sources of MediaSPIP in its standalone version.
    To get a working installation, you must manually install all-software dependencies on the server.
    If you want to use this archive for an installation in "farm mode", you will also need to proceed to other manual (...)

  • MediaSPIP Player : les contrôles

    26 mai 2010, par

    Les contrôles à la souris du lecteur
    En plus des actions au click sur les boutons visibles de l’interface du lecteur, il est également possible d’effectuer d’autres actions grâce à la souris : Click : en cliquant sur la vidéo ou sur le logo du son, celui ci se mettra en lecture ou en pause en fonction de son état actuel ; Molette (roulement) : en plaçant la souris sur l’espace utilisé par le média (hover), la molette de la souris n’exerce plus l’effet habituel de scroll de la page, mais diminue ou (...)

Sur d’autres sites (6259)

  • Web Analytics Reports : 10 Key Types and How to Use Them

    29 janvier 2024, par Erin

    You can’t optimise your website to drive better results if you don’t know how visitors are engaging with your site.

    But how do you correctly analyse data and identify patterns ? With the right platform, you can use a wide range of web analytics reports to dive deep into the data.

    In this article, we’ll discuss what website analytics reports are, different types, why you need them, and how to use reports to find the insights you need.

    What is web analytics ?

    Website analytics is the process of gathering, processing, and analysing data that shows what users are doing when they visit your website. 

    You typically achieve this with web analytics tools by adding a tracking code that shares data with the analytics platform when someone visits the site.

    Illustration of how website analytics works

    The visitors trigger the tracking code, which collects data on how they act while on your site and then sends that information to the analytics platform. You can then see the data in your analytics solution and create reports based on this data.

    While there are a lot of web analytics solutions available, this article will specifically demonstrate reports using Matomo.

    What are web analytics reports ?

    Web analytics reports are analyses that focus on specific data points within your analytics platform. 

    For example, this channel report in Matomo shows the top referring channels of a website.

    Channel types report in Matomo analytics

    Your marketing team can use this report to determine which channels drive the best results. In the example above, organic search drives almost double the visits and actions of social campaigns. 

    If you’re investing the same amount of money, you’d want to move more of your budget from social to search.

    Why you need to get familiar with specific web analytics reports

    The default web analytics dashboard offers an overview of high-level trends in performance. However, it usually does not give you specific insights that can help you optimise your marketing campaigns.

    For example, you can see that your conversions are down month over month. But, at a glance, you do not understand why that is.

    To understand why, you need to go granular and wider — looking into qualifying data that separates different types of visitors from each other.

    Gartner predicts that 70% of organisations will focus on “small and wide” data by 2025 over “big data.” Most companies lack the data volume to simply let big data and algorithms handle the optimising.

    What you can do instead is dive deep into each visitor. Figure out how they engage with your site, and then you can adjust your campaigns and page content accordingly.

    Common types of web analytics reports

    There are dozens of different web analytics reports, but they usually fall into four separate categories :

    Diagram that illustrates the main types of web analytics reports
    • Referral sources : These reports show where your visitors come from. They range from channel reports — search, social media — to specific campaigns and ads.
    • Engagement (on-site actions) : These reports dive into what visitors are doing on your site. They break down clicks, scrolling, completed conversion goals, and more.
    • E-commerce performance : These reports show the performance of your e-commerce store. They’ll help you dive into the sales of individual products, trends in cart abandonment and more.
    • Demographics : These reports help you understand more about your visitors — where they’re visiting from, their browser language, device, and more.

    You can even combine insights across all four using audience segmentation and custom reports. (We’ll cover this in more detail later.)

    How to use 10 important website analytics reports

    The first step is to install the website analytics code on your website. (We include more detailed information in our guide on how to track website visitors.)

    Then, you need to wait until you have a few days (or, if you have limited traffic, a few weeks) of data. Without sufficient website visitor data, none of the reports will be meaningful.

    Visitor Overview report

    First, let’s take a look at the Visitor Overview report. It’s a general report that breaks down the visits over a given time period.

    Visitor overview report in Matomo

    What this report shows :

    • Trends in unique visits month over month
    • Basic engagement trends like the average visit length and bounce rate
    • The number of actions taken per page

    In general, this report is more of a high-level indicator you can use to explore certain areas more thoroughly. For example, if most of your traffic comes from organic traffic or social media, you can dive deeper into those channels.

    Try Matomo for Free

    Get the web insights you need, without compromising data accuracy.

    No credit card required

    Location report

    Next up, we have the most basic type of demographic report — the Location report. It shows where your visitors tend to access your website from.

    Location report in Matomo

    What this report shows :

    • The country, state or city your visitors access your website from

    This report is most useful for identifying regional trends. You may notice that your site is growing in popularity in a country. You can take advantage of this by creating a regional campaign to double down on a high performing audience.

    Device report

    Next, we have the Device report, which breaks down your visitors’ devices.

    Device report in Matomo analytics

    What this report shows :

    • Overall device types used by your visitors
    • Specific device models used

    Today, most websites are responsive or use mobile-first design. So, just seeing that many people access your site through smartphones probably isn’t all that surprising.

    But you should ensure your responsive design doesn’t break down on popular devices. The design may not work effectively because many phones have different screen resolutions. 

    Users Flow report

    The Users Flow report dives deeper into visitor engagement — how your visitors act on your site. It shows common landing pages — the first page visitors land on — and how they usually navigate your site from there.

    Users flow report in Matomo analytics

    What this report shows :

    • Popular landing pages
    • How your visitors most commonly navigate your site

    You can use this report to determine which intermediary pages are crucial to keeping visitors engaged. For example, you can prioritise optimisation and rewriting for case study pages that don’t get a lot of direct search or campaign traffic.

    Improving this flow can improve conversion rates and the impact of your marketing efforts.

    Try Matomo for Free

    Get the web insights you need, without compromising data accuracy.

    No credit card required

    Exit Pages report

    The Exit Pages report complements the Users Flow report well. It highlights the most common pages visitors leave your website from.

    Exit pages report in Matomo analytics

    What this report shows :

    • The most common exit pages on your website
    • The exit rates of these pages

    Pages with high exit rates fall into two categories. The first are pages where it makes sense that visitors leave, like a post-purchase thank-you page. The second are pages where you’d want your visitors to stay and keep flowing down the funnel. When the rates are unusually high on product pages, category pages, or case study pages, you may have found a problem.

    By combining insights from the Users Flow and Exit Pages reports, you can find valuable candidates for optimisation. This is a key aspect of effective conversion rate optimisation.

    Traffic Acquisition Channel report

    The Acquisition Channels report highlights the channels that drive the most visitors to your site.

    Acquisition report in Matomo analytics

    What this report shows :

    • Top referring traffic sources by channel type
    • The average time on site, bounce rates, and actions taken by the source

    Because of increasingly privacy-sensitive browsers and apps, the best way to reliably track traffic sources is to use campaign tracking URL. Matomo offers an easy-to-use campaign tracking URL builder to simplify this process.

    Search Engines and Keywords report

    The Search Engines and Keywords report shows which keywords are driving the most organic search traffic and from what search engines.

    Search engine keyword report in Matomo analytics

    What this report shows :

    • Search engine keywords that drive traffic
    • The different search engines that refer visitors

    One of the best ways to use this report is to identify low-hanging fruit. You want to find keywords driving some traffic where your page isn’t ranked in the top three results. If the keyword has high traffic potential, you should then work to optimise that page to rank higher and get more traffic. This technique is an efficient way to improve your SEO performance.

    Ecommerce Products report

    If you sell products directly on your website, the Ecommerce Products report is a lifesaver. It shows you exactly how all your products are performing.

    Ecommerce product report in Matomo analytics

    What this report shows :

    • How your products are selling
    • The average sale price (with coupons) and quantity

    This report could help an online retailer identify top-selling items, adjust pricing based on average sale prices, and strategically allocate resources to promote or restock high-performing products for maximum profitability.

    Try Matomo for Free

    Get the web insights you need, without compromising data accuracy.

    No credit card required

    Ecommerce Log report

    If you want to explore every single ecommerce interaction, the Ecommerce Log report is for you. It breaks down the actions of visitors who add products to their cart in real time.

    Ecommerce log report in Matomo analytics

    What this report shows :

    • The full journey of completed purchases and abandoned carts
    • The exact actions your potential customers take and how long their journeys last

    If you suspect that the user experience of your online store isn’t perfect, this report helps you confirm or deny that suspicion. By closely examining individual interactions, you can identify common exit pages or other issues.

  • A *hot* Piwik Community Meetup 2015 !

    10 août 2015 — Community

    Last weekend I arrived in Germany to attend the Piwik Community Meetup 2015 and now I am in Poland. I joined Piwik PRO back in May as enterprise support project coordinator in North America. I am now writing this from the Piwik PRO main office in Wrocław, where I’ll be working from for the next two weeks.

    The meetup was HOT in every sense ! Berlin temperatures reached 35 degrees (celsius), as I finally meet in person several long-time, dedicated Piwik community contributors.

    Meetup preparation in Berlin, photo by M. Zawadziński, licensed under CC-BY-SA 4.0

    Pictures from the meetup preparation sessions

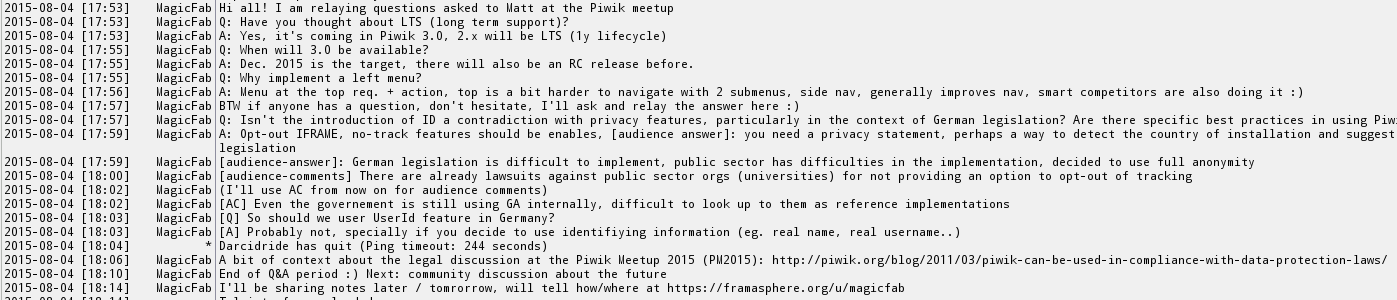
    In the first leg of my trip I was in Berlin to meet Piwik community members and Piwik PRO staff to prepare for the 2015 annual Piwik community meetup. These are my notes taken during the meeting at the request of one of my colleagues. I also relayed live on Framasphère, Twitter and IRC.

    Community discussion at the meetup, photo by D.Czajka, licensed under CC-BY-SA 4.0

    More pictures from the Piwik meetup

    This was harder than I expected, as I took notes with my laptop, pictures with my phone, wrote live to social media (using the Android Diaspora Native Web App), and used my laptop to relay on IRC. Going forward this requires better preparation, I was glad I had a few links and pictures ready before hand but it really requires intense focus to achieve this. I am glad presenters were patient when I requested repeating some of the ideas they shared. I am also a bit disappointed not much happened in IRC.

    Two day preparation sessions

    The discussions and session we had during the two days prior to the meetup are available here.

    We gathered in rented apartments in Berlin, this reminded me very much of similar community gatherings and perhaps of BarCamp and, at a much smaller scale, UDS sessions.

    Piwik Pizza !, photo by F. Rodríguez, licensed under CC-BY-SA 4.0

    A list of ideas of topics was initially submitted, we then proceeded to have scheduled sessions for open discussion. Several people shared their concern there was no possible remote participation which led to making public the Trello boards used/linked here.

    Note : The Trello links below still have action items and notes that are pending bug report / feature requests filing which should happen over the coming weeks. Most importantly, many action items will need identifying leads for different community team including Translations and Documentation, and better coordination of coming community engagement.

    Monday sessions consisted of the following subjects :

    On Tuesday we met again to discuss the following subjects :

    Some more details about individual preparation sessions

    What are Piwik values & how to communicate them ?

    The main subjects in this session were important changes proposed in the project mission and values. This was edited directly on on the wiki page on GitHub, some of the changes can be seen by comparing revisions.

    Piwik mission statement (bug #7376)

    “To create the leading Free and open source analytics platform, and to support global organisations and communities to keep full control over their data.”

    Our values

    • Openness
    • Freedom
    • Transparency
    • Data ownership
    • Privacy
    • Kaizen (改善) : continuous improvement

    This was also presented by Matthieu Aubry at the meetup and is published in the Roadmap page. Bringing more visibility and perhaps having a top page for Mission and Values was also brought up.

    Meetup agenda and notes

    The official agenda is available here.

    Many Piwik PRO employees stayed in Berlin for the meetup, and we had good participation although less than last year in Munich as my colleagues told me. Some were consultants, others staff from public organizations, universities, etc. In retrospect considering the very hot weather and summer holidays the attendance was good. I was very happy to arrive at the beautiful Kulturbrauerei and enter the air-conditioned Soda Club. T-Shirts were waiting for all attendees and free drinks (non-alcohol !) were welcome

  • 7 Ecommerce Metrics to Track and Improve in 2024

    12 avril 2024, par Erin

    You can invest hours into market research, create the best ads you’ve ever seen and fine-tune your budgets. But the only way to really know if your digital marketing campaigns move the needle is to track ecommerce metrics.

    It’s time to put your hopes and gut feelings aside and focus on the data. Ecommerce metrics are key performance indicators that can tell you a lot about the performance of a single campaign, a traffic source or your entire marketing efforts. 

    That’s why it’s essential to understand what ecommerce metrics are, key metrics to track and how to improve them. 

    Ready to do all of the above ? Then, let’s get started.

    What are ecommerce metrics ? 

    An ecommerce metric is any metric that helps you understand the effectiveness of your digital marketing efforts and the extent to which users are taking a desired action. Most ecommerce metrics focus on conversions, which could be anything from making a purchase to subscribing to your email list.

    You need to track ecommerce metrics to understand how well your marketing efforts are working. They are essential to helping you run a cost-effective marketing campaign that delivers a return on investment. 

    For example, tracking ecommerce metrics will help you identify whether your digital marketing campaigns are generating a return on investment or whether they are actually losing money. They also help you identify your most effective campaigns and traffic sources. 

    Ecommerce metrics also help you spot opportunities for improvement both in terms of your marketing campaigns and your site’s UX. 

    For instance, you can use ecommerce metrics to track the impact on revenue of A/B tests on your marketing campaigns. Or you can use them to understand how users interact with your website and what, if anything, you can do to make it more engaging.

    What’s the difference between conversion rate and conversion value ?

    The difference between a conversion rate and a conversion value is that the former is a percentage while the latter is a monetary value. 

    There can be confusion between the terms conversion rate and conversion value. Since conversions are core metrics in ecommerce, it’s worth taking a minute to clarify. 

    Conversion rates measure the percentage of people who take a desired action on your website compared to the total number of visitors. If you have 100 visitors and one of them converts, then your conversion rate is 1%. 

    Here’s the formula for calculating your conversion rate :

    Conversion Rate (%) = (Number of conversions / Total number of visitors) × 100

    Conversion rate formula

    Using the example above :

    Conversion Rate = (1 / 100) × 100 = 1%

    Conversion value is a monetary amount you assign to each conversion. In some cases, this is the price of the product a user purchases. In other conversion events, such as signing up for a free trial, you may wish to assign a hypothetical conversion value. 

    To calculate a hypothetical conversion value, let’s consider that you have estimated the average revenue generated from a paying customer is $300. If the conversion rate from free trial to paying customer is 20%, then the hypothetical conversion value for each free trial signup would be $300 multiplied by 20%, which equals $60. This takes into account the number of free trial users who eventually become paying customers.

    So the formula for hypothetical conversion value looks like this :

    Hypothetical conversion value formula

    Hypothetical conversion value = (Average revenue per paying customer) × (Conversion rate)

    Using the values from our example :

    Hypothetical conversion value = $300 × 20% = $60

    The most important ecommerce metrics and how to track them

    There are dozens of ecommerce metrics you could track, but here are seven of the most important. 

    Conversion rate

    Conversion rate is the percentage of visitors who take a desired action. It is arguably one of the most important ecommerce metrics and a great top-level indicator of the success of your marketing efforts. 

    You can measure the conversion rate of anything, including newsletter signups, ebook downloads, and product purchases, using the following formula :

    Conversion rate

    Conversion rate = (Number of people who took action / Total number of visitors) × 100

    You usually won’t have to manually calculate your conversion rate, though. Almost every web analytics or ad platform will track the conversion rate automatically.

    Matomo, for instance, automatically tracks any conversion you set in the Goals report.

    A screenshot of Matomo's Goals report

    As you can see in the screenshot, your site’s conversions are plotted over a period of time and the conversion rate is tracked below the graph. You can change the time period to see how your conversion rate fluctuates.

    If you want to go even further, track your new visitor conversion rate to see how engaging your site is to first-time visitors. 

    Try Matomo for Free

    Get the web insights you need, without compromising data accuracy.

    No credit card required

    Cost per acquisition

    Cost per acquisition (CPA) is the average cost of acquiring a new user. You can calculate your overall CPA or you can break CPA down by email campaign, traffic source, or any other criteria. 

    Calculate CPA by dividing your total marketing cost by the number of new users you acquire.

    Cost per acquisition = Total marketing cost / Number of customers acquired

    CPA = Total marketing cost​ / Number of new users acquired 

    So if your Google Ads campaign costs €1,000 and you acquire 100 new users, your CPA is €10 (1000/100=10).

    It’s important to note that CPA is not the same as customer acquisition cost. Customer acquisition cost considers the number of paying customers. CPA looks at the number of users taking a certain action, like subscribing to a newsletter, making a purchase, or signing up for a free trial.

    Cost per acquisition is a direct measure of your marketing efforts’ effectiveness, especially when comparing CPA to average customer spend and return on ad spend. 

    If your CPA is higher than the average customer spend, your marketing campaign is profitable. If not, then you can look at ways to either increase customer spend or decrease your cost per acquisition.

    Customer lifetime value

    Customer lifetime value (CLV) is the average amount of money a customer will spend with your ecommerce brand over their lifetime. 

    Customer value is the total worth of a customer to your brand based on their purchasing behaviour. To calculate it, multiply the average purchase value by the average number of purchases. For instance, if the average purchase value is €50 and customers make 5 purchases on average, the customer value would be €250.

    Use this formula to calculate customer value :

    Customer value = Average purchase value × Average number of purchases

    Customer value = Average purchase value × Average number of purchases

    Then you can calculate customer lifetime value using the following formula :

    Customer lifetime value = Customer value * Average customer lifespan

    CLV = Customer value × Average customer lifespan

    In another example, let’s say you have a software company and customers pay you €500 per year for an annual subscription. If the average customer lifespan is 5 years, then the Customer Lifetime Value (CLV) would be €2,500.

    Customer lifetime value = €500 × 5 = €2,500

    Knowing how much potential customers are likely to spend helps you set accurate marketing budgets and optimise the price of your products. 

    Return on investment

    Return on investment (ROI) is the amount of revenue your marketing efforts generate compared to total spend. 

    It’s usually calculated as a percentage using the following formula :

    Return On Investment = (Revenue / Total Spend) x 100

    ROI = (Revenue / Total spend) × 100

    If you spend €1,000 on a paid ad campaign and your efforts bring in €5,000, then your ROI is 500% (5,000/1,000 × 100).

    With a web analytics tool like Matomo, you can quickly see the revenue generated from each traffic source and you can drill down further to compare different social media channels, search engines, referral websites and campaigns to get more granular view. 

    Revenue by channel in Matomo

    In the example above in Matomo’s Marketing Attribution feature, we can see that social networks are generating the highest amount of revenue in the year. To calculate ROI, we would need to compare the amount of investment to each channel. 

    Let’s say we invested $1,000 per year in search engine optimisation and content marketing, the return on investment (ROI) stands at approximately 2576%, based on a revenue of $26,763.48 per year. 

    Conversely, for organic social media campaigns, where $5,000 was invested and revenue amounted to $71,180.22 per year, the ROI is approximately 1323%. 

    Despite differences in revenue generation, both channels exhibit significant returns on investment, with SEO and content marketing demonstrating a much higher ROI compared to organic social media campaigns. 

    With that in mind, we might want to consider shifting our marketing budget to focus more on search engine optimisation and content marketing as it’s a greater return on investment.

    Try Matomo for Free

    Get the web insights you need, without compromising data accuracy.

    No credit card required

    Return on ad spend

    Return on ad spend (ROAS) is similar to return on investment, but it measures the profitability of a specific ad or campaign.

    Calculate ROAS using the following formula :

    Return on ad Spend = revenue / ad cost

    ROAS = Revenue / Ad cost 

    A positive ROAS means you are making money. If you generate €3 for every €1 you spend on advertising, for example, there’s no reason to turn off that campaign. If you only make €1 for every €2 you spend, however, then you need to shut down the campaign or optimise it. 

    Bounce rate

    Bounce rate is the percentage of visitors who leave your site without taking another action. Calculate it using the following formula :

    Bounce rate = (Number of visitors who bounce / Total number of visitors) * 100

    Bounce rate = (Number of visitors who bounce / Total number of visitors) × 100

    Some portion of users will always leave your site immediately, but you should aim to make your bounce rate as low as possible. After all, every customer that bounces is a missed opportunity that you may never get again. 

    You can check the bounce rate for each one of your site’s pages using Matomo’s page analytics report. Web analytics tools like Google Analytics can track bounce rates for online stores also. 

    A screenshot of Matomo's page view report A screenshot of Matomo's page view report

    Bounce rate is calculated automatically. You can sort the list of pages by bounce rate allowing you to prioritise your optimisation efforts. 

    Don’t stop there, though. Explore bounce rate further by comparing your mobile bounce rate vs. desktop bounce rate by segmenting your traffic. This will highlight whether your mobile site needs improving. 

    Try Matomo for Free

    Get the web insights you need, without compromising data accuracy.

    No credit card required

    Click-through rate

    Your clickthrough rate (CTR) tells you the number of people who click on your ads as a percentage of total impressions. You can calculate it by dividing the number of clicks your ad gets by the total number of times people see it. 

    So the formula looks like this :

    Click-through Rate = (Number of clicks / Total impressions) × 100

    CTR (%) = (Number of clicks / Total impressions​) × 100

    If an ad gets 1,000 impressions and 10 people click on it, then the CTR will be 10/1,000 × 100 = 1%

    You don’t usually need to calculate your clickthrough rate manually, however. Most ad platforms like Google Ads will automatically calculate CTR.

    What is considered a good ecommerce sales conversion rate ?

    This question is so broad it’s almost impossible to answer. The thing is, sales conversion rates vary massively depending on the conversion event and the industry. A good conversion rate in one industry might be terrible in another. 

    That being said, research shows that the average website conversion rate across all industries is 2.35%. Of course, some websites convert much better than this. The same study found that the top 25% of websites across all industries have a conversion rate of 5.31% or higher. 

    How can you improve your conversion rate ?

    Ecommerce metrics don’t just let you track your campaign’s ROI, they help you identify ways to improve your campaign. 

    Use these five tips to start improving your marketing campaign’s conversion rates today :

    Run A/B tests

    The most effective way to improve almost all of the ecommerce metrics you track is to test, test, and test again.

    A/B testing or multivariate testing compares two different versions of the same content, such as a landing page or blog post. Seeing which version performs better can help you squeeze as many conversions as possible from your website and ad campaigns. But only if you test as many things as possible. This should include :

    • Ad placement
    • Ad copy
    • CTAs
    • Headlines
    • Straplines
    • Colours
    • Design

    To create and analyse tests and their results effectively, you’ll need either an A/B testing platform or a web analytics solution like Matomo, which offers one out of the box.

    A/B testing in Matomo analytics

    Matomo’s A/B Testing feature makes it easy to create and track tests over time, breaking down each test’s variations by the metrics that matter. It automatically calculates statistical significance, too, meaning you can be sure you’re making a change for the better. 

    Try Matomo for Free

    Get the web insights you need, without compromising data accuracy.