Recherche avancée

Médias (3)

Mot : - Tags -/spip

Autres articles (87)

  • L’utiliser, en parler, le critiquer

    10 avril 2011

    La première attitude à adopter est d’en parler, soit directement avec les personnes impliquées dans son développement, soit autour de vous pour convaincre de nouvelles personnes à l’utiliser.
    Plus la communauté sera nombreuse et plus les évolutions seront rapides ...
    Une liste de discussion est disponible pour tout échange entre utilisateurs.

  • Use, discuss, criticize

    13 avril 2011, par

    Talk to people directly involved in MediaSPIP’s development, or to people around you who could use MediaSPIP to share, enhance or develop their creative projects.
    The bigger the community, the more MediaSPIP’s potential will be explored and the faster the software will evolve.
    A discussion list is available for all exchanges between users.

  • Mediabox : ouvrir les images dans l’espace maximal pour l’utilisateur

    8 février 2011, par

    La visualisation des images est restreinte par la largeur accordée par le design du site (dépendant du thème utilisé). Elles sont donc visibles sous un format réduit. Afin de profiter de l’ensemble de la place disponible sur l’écran de l’utilisateur, il est possible d’ajouter une fonctionnalité d’affichage de l’image dans une boite multimedia apparaissant au dessus du reste du contenu.
    Pour ce faire il est nécessaire d’installer le plugin "Mediabox".
    Configuration de la boite multimédia
    Dès (...)

Sur d’autres sites (8533)

  • Organic Traffic : What It Is and How to Increase It

    19 septembre 2023, par Erin — Analytics Tips

    Organic traffic can be a website’s most valuable source of visitors. But it can also be the hardest form of traffic to acquire. While paid ads can generate traffic almost instantly, you need to invest time and energy into growing traffic from search engines.

    And it all starts with understanding exactly what organic traffic is. 

    If you want to understand what organic traffic is, how to measure it and how to generate more of it, then this article is for you.

    What is organic traffic ?

    Organic traffic is the visitors your website receives from the unpaid results on search engines like Google, Bing and DuckDuckGo. 

    The higher your website ranks in the search engine results pages and the more search terms your website ranks for, the more organic traffic your site will receive. 

    Organic traffic is highly valued by marketers, partly because it has a much higher clickthrough rate than PPC ads. Research shows the top organic result has a 39.8% CTR compared to just 2.1% for paid ads.

    So, while you can pay to appear at the top of search engines (using a platform like Google Ads, for instance), you probably won’t receive as much traffic as you would if you were to rank organically in the same search engine.

    What other types of traffic are there ? 

    Organic traffic isn’t the only type of traffic your website can get. You can also receive traffic from the following channels :

    Direct

    People familiar with your site may visit it directly, either by entering your URL into their browser or accessing it through a bookmarked link ; both scenarios are counted as direct traffic.

    Social

    Social traffic includes visits to your website from a social media platform. For example, if someone shares a link to your website on Facebook, any user who clicks on it will be counted as social traffic. 

    Websites

    Social media isn’t the only way for someone to share a link to your website. Any time a visitor finds your website by clicking on a link on another website, it will be counted as “websites”. This is also known as referral traffic on some analytics platforms. 

    Campaign

    Campaign traffic encompasses both paid and unpaid traffic sources. Paid sources include advertising on search engines and social media (also known as PPC or pay-per-click), as well as collaborations with influencers and sponsorships. Unpaid sources, such as your organisation’s email newsletters, cross-promotions with other businesses and other similar methods, are also part of this mix. 

    In simpler terms, it’s the traffic you deliberately direct to your site, and you utilise campaign tracking URLs to measure how these efforts impact your ROI.

    A word on multi-touch attribution

    If you are interested in learning more about types of traffic to track conversions, then it’s important to understand multi-touch attribution. The truth is most customers won’t just use a single traffic channel to find your website. In reality, the modern customer journey has multiple touchpoints, and customers may first find your site through an ad and then search for more about your brand on Google before going directly to your website. 

    You are at risk of under or overestimating the effectiveness of a marketing channel without using multi-touch attribution tracking. With this marketing analytics model, you can accurately weigh the impact of every channel and allocate budgets accordingly. 

    What are the benefits of organic traffic ?

    Getting more organic traffic is a common marketing goal for many companies. And it’s not surprising why. There’s a lot to love about organic traffic. 

    For starters, it’s arguably the most cost-effective traffic your site can receive. You will still need to pay to create and distribute organic content (whether it’s a blog post or product page). You don’t need to pay for it to show up in a search engine. You continue to get value from organic traffic long after you’ve created the page, too. A good piece of organic content can receive high volumes of monthly visitors for years. That’s a stark difference from paid ads, where traffic stops as soon as you turn off the ad. 

    It also puts your website in front of a massive audience, with Google alone processing over 3.5 billion searches every day. There’s a good chance that if your target audience is looking for a solution to their problems, they start with Google. 

    Organic traffic is fantastic at building brand awareness. Usually, users aren’t searching for a specific brand or company. They are searching for informational keywords (“how to brew the perfect cup of coffee”) or unbranded transactional keywords (“best home workout machine”). In both cases, customers can use search engines to become aware of your brand. 

    Finally, organic traffic brings in high-quality leads at every marketing funnel stage. Because users are searching for informational and transactional keywords, your site can receive visits from buyers at every stage of the marketing funnel, giving you multiple chances to convert them and helping to increase the number of touch points you have.

    How to check your website’s organic traffic

    You don’t need to complete complex calculations to determine your site’s organic traffic. A web analytics solution like Matomo will accurately measure your site’s organic traffic. 

    In Matomo, on the left-hand sidebar, you can access organic traffic data by clicking Acquisition and then selecting All Channels.

    You’ll find a detailed breakdown of all traffic sources, including organic traffic, within the specified timeframe. The report is set to the current day by default, but you can view organic traffic metrics over a day, week, month, year or a date range of your choice.

    If you want to take things further, you can get a detailed view of organic visitors by creating a custom report for “Visitors from Search Engines only.” By creating a custom report with the segment “Channel Type is search”, you’ll be able to combine other metrics like average actions per visit, bounce rate, goal conversions, etc., to create a comprehensive report on your organic traffic and the behavior of these visitors.

    Matomo also lets you integrate Google, Bing and Yahoo search consoles directly into your Matomo Analytics to monitor keyword performance.

    How to increase organic traffic

    Follow these six tips if you want to increase the web traffic you get organically from search engines. 

    Create more and better content

    Here’s the reality : Most websites don’t get much traffic from Google. Only 40% of sites rank on the first page, and just 23% sit in the top three results. 

    Let’s take quality first. The best content tends to rise to the top of search engines. That’s because it gets shared more, receives more backlinks and gets more user engagement. So, if you want to appear at the top of Google results, creating mediocre content probably won’t cut it. You need to go above and beyond what is already there. 

    But you can’t just create one fantastic piece of content and expect to receive thousands of visitors. You need multiple pages targeting as many search terms as possible. The more pages search engines index, the more opportunities you have to rank. Or, to put it another way, the more shots you take, the greater your chances of scoring. 

    Use keyword research tools

    While creating great content is essential, you want to ensure that content targets the right keywords. These keywords receive a suitable amount of traffic and are easy to rank for. 

    Keyword research tools like Ahrefs of Semrush are the easiest way to find high-traffic topics to write about. Specifically, you want to aim for long-tail keywords. These are search terms that contain three or more words. Think “Nike men’s basketball shoe” rather than “basketball shoe.”

    A keyword research report for "Basketball shoe"

    As you can see, long tail keywords have a lower monthly search volume (250 vs. 1,100 using the example above) than broad terms but are much easier to rank for (14 vs. 41 Keyword Difficulty).

    A keywords research report for Nike Men's basketball shoe

    While the above tools can help you find new topics to write about, Matomo’s Search Engine Keywords Performance plugin can help highlight topics you have already covered that could be expanded.

    Use Matomo's Search Engine Keywords Performance Plugin to see which keywords visitors use t find your website

    The plugin automatically connects to APIs from all significant search engines and imports all the keywords people search for when clicking on your websites into your Matomo report. 

    If you find a cluster of keywords on the same topic that generates a lot of visitors, it may be worth creating even more content on that topic. Similarly, if there’s a topic you think you have covered but isn’t generating much traffic, you can look at revising and refreshing your existing content to try to rank higher. 

    Build high-quality backlinks

    Backlinks are arguably the most important Google ranking factor and the primary way Google assesses the authoritativeness of your site and content. Backlinks strongly and positively correlate with traffic — at least according to 67.5% of respondents in a uSERP industry survey. 

    There are plenty of ways you can create high-quality backlinks that Google loves. Strategies include :

    • Creating and promoting the best content about a given topic
    • Guest posting on high-authority websites
    • Building relationships with other websites

    Ensure you avoid building low-quality spam links at all costs — such as private blog networks (PBNs), forum and comment spam links and directory links. These links won’t help your content to rank higher, and Google may even penalise your entire site if you build them. 

    Find and fix any technical Search Engine Optimisation (SEO) issues

    Search engines like Google need to be able to quickly and accurately crawl and index your website to rank your content. Unfortunately, many sites suffer from technical issues that impede search engine bots. 

    The good news is that certain tools make these issues easy to spot. Take the Matomo SEO Web Vitals feature, for instance. This lets you track a set of core web vital metrics, including :

    • Page Speed Score
    • First Contentful Paint (FCP)
    • Final Input Delay (FID)
    • Last Contentful Paint (LCP)
    • Cumulative Layout Shift (CLS)

    Take things even further by identifying major bugs and issues with your site. Crashes and other issues that impact user experience can also hurt your SEO and organic traffic efforts — so it’s best to eliminate them as soon as they occur. 

    See which bugs cause your site to crash and how you can recreate them

    Use Matomo’s Crash Analytics feature to get precise bug location information as well as the user’s interactions that triggered, the device they were using, etc. Scheduled reporting and alerts allow you to automate this task and instantly detect bugs as soon as they occur.

    Improve your on-page SEO

    As well as fixing technical issues, you should spend time optimising specific elements of your website to improve how it ranks in search engines. 

    There are several on-page elements you should optimise :

    • Image alt tags
    • URLs
    • Headings
    • Title tags
    • Internal links

    Your goal should be to include a target keyword in each element above. For example, your URL should be something like yoursite.com/keyword.

    It’s best to err on the side of caution here. Avoid adding too many keywords to each of these elements. This is called keyword stuffing, and Google may slap your site with a penalty. 

    Track your content’s performance

    One final way to increase organic traffic is to use an analytics platform to understand what content needs improving and which pages can be removed.

    Use Matomo's heatmap to see how customers interact with your wesbite

    Use an analytics platform like Matomo to see which pages generate the most organic traffic and which lag behind. This can help you prioritise your SEO efforts while highlighting pages that add no value. These pages can be completely revamped, redirected to another page or removed if appropriate. 

    Conclusion

    Organic traffic is arguably the most valuable traffic source your site can acquire. It is essential to monitor organic traffic levels and take steps to increase your organic traffic. 

    A good analytics platform can help you do both. Matomo’s powerful, open-source web analytics solution protects your data and your users’ privacy, while providing the SEO tools you need to send your organic traffic levels soaring. 

    Start a free 21-day trial now, no credit card required.

  • Unveiling GA4 Issues : 8 Questions from a Marketer That GA4 Can’t Answer

    8 janvier 2024, par Alex

    It’s hard to believe, but Universal Analytics had a lifespan of 11 years, from its announcement in March 2012. Despite occasional criticism, this service established standards for the entire web analytics industry. Many metrics and reports became benchmarks for a whole generation of marketers. It truly was an era.

    For instance, a lot of marketers got used to starting each workday by inspecting dashboards and standard traffic reports in the Universal Analytics web interface. There were so, so many of those days. They became so accustomed to Universal Analytics that they would enter reports, manipulate numbers, and play with metrics almost on autopilot, without much thought.

    However, six months have passed since the sunset of Universal Analytics – precisely on July 1, 2023, when Google stopped processing requests for resources using the previous version of Google Analytics. The time when data about visitors and their interactions with the website were more clearly structured within the UA paradigm is now in the past. GA4 has brought a plethora of opportunities to marketers, but along with those opportunities came a series of complexities.

    GA4 issues

    Since its initial announcement in 2020, GA4 has been plagued with errors and inconsistencies. It still has poor and sometimes illogical documentation, numerous restrictions, and peculiar interface solutions. But more importantly, the barrier to entry into web analytics has significantly increased.

    If you diligently follow GA4 updates, read the documentation, and possess skills in working with data (SQL and basic statistics), you probably won’t feel any problems – you know how to set up a convenient and efficient environment for your product and marketing data. But what if you’re not that proficient ? That’s when issues arise.

    In this article, we try to address a series of straightforward questions that less experienced users – marketers, project managers, SEO specialists, and others – want answers to. They have no time to delve into the intricacies of GA4 but seek access to the fundamentals crucial for their functionality.

    Previously, in Universal Analytics, they could quickly and conveniently address their issues. Now, the situation has become, to put it mildly, more complex. We’ve identified 8 such questions for which the current version of GA4 either fails to provide answers or implies that answers would require significant enhancements. So, let’s dive into them one by one.

    Question 1 : What are the most popular traffic sources on my website ?

    Seemingly a straightforward question. What does GA4 tell us ? It responds with a question : “Which traffic source parameter are you interested in ?”

    GA4 traffic source

    Wait, what ?

    People just want to know which resources bring them the most traffic. Is that really an issue ?

    Unfortunately, yes. In GA4, there are not one, not two, but three traffic source parameters :

    1. Session source.
    2. First User Source – the source of the first session for each user.
    3. Just the source – determined at the event or conversion level.

    If you wanted to open a report and draw conclusions quickly, we have bad news for you. Before you start ranking your traffic sources by popularity, you need to do some mental work on which parameter and in what context you will look. And even when you decide, you’ll need to make a choice in the selection of standard reports : work with the User Acquisition Report or Traffic Acquisition.

    Yes, there is a difference between them : the first uses the First User Source parameter, and the second uses the session source. And you need to figure that out too.

    Question 2 : What is my conversion rate ?

    This question concerns everyone, and it should be simple, implying a straightforward answer. But no.

    GA4 conversion rate

    In GA4, there are three conversion metrics (yes, three) :

    1. Session conversion – the percentage of sessions with a conversion.
    2. User conversion – the percentage of users who completed a conversion.
    3. First-time Purchaser Conversion – the share of active users who made their first purchase.

    If the last metric doesn’t interest us much, GA4 users can still choose something from the remaining two. But what’s next ? Which parameters to use for comparison ? Session source or user source ? What if you want to see the conversion rate for a specific event ? And how do you do this in analyses rather than in standard reports ?

    In the end, instead of an answer to a simple question, marketers get a bunch of new questions.

    Question 3. Can I trust user and session metrics ?

    Unfortunately, no. This may boggle the mind of those not well-versed in the mechanics of calculating user and session metrics, but it’s the plain truth : the numbers in GA4 and those in reality may and will differ.

    GA4 confidence levels

    The reason is that GA4 uses the HyperLogLog++ statistical algorithm to count unique values. Without delving into details, it’s a mechanism for approximate estimation of a metric with a certain level of error.

    This error level is quite well-documented. For instance, for the Total Users metric, the error level is 1.63% (for a 95% confidence interval). In simple terms, this means that 100,000 users in the GA4 interface equate to 100,000 1.63% in reality.

    Furthermore – but this is no surprise to anyone – GA4 samples data. This means that with too large a sample size or when using a large number of parameters, the application will assess your metrics based on a partial sample – let’s say 5, 10, or 30% of the entire population.

    It’s a reasonable assumption, but it can (and probably will) surprise marketers – the metrics will deviate from reality. All end-users can do (excluding delving into raw data methodologies) is to take this error level into account in their conclusions.

    Question 4. How do I calculate First Click attribution ?

    You can’t. Unfortunately, as of late, GA4 offers only three attribution models available in the Attribution tab : Last Click, Last Click For Google Ads, and Data Driven. First Click attribution is essential for understanding where and when demand is generated. In the previous version of Google Analytics (and until recently, in the current one), users could quickly apply First Click and other attribution models, compare them, and gain insights. Now, this capability is gone.

    GA4 attribution model

    Certainly, you can look at the conversion distribution considering the First User Source parameter – this will be some proxy for First Click attribution. However, comparing it with others in the Model Comparison tab won’t be possible. In the context of the GA4 interface, it makes sense to forget about non-standard attribution models.

    Question 5. How do I account for intra-session traffic ?

    Intra-session traffic essentially refers to a change in traffic sources within a session. Imagine a scenario where a user comes to your site organically from Google and, within a minute, comes from an email campaign. In the previous version of Google Analytics, a new session with the traffic source “e-mail” would be created in such a case. But now, the situation has changed.

    A session now only ends in the case of a timeout – say, 30 minutes without interaction. This means a session will always have a source from which it started. If a user changes the source within a session (clicks on an ad, from email campaigns, and so on), you won’t know anything about it until they convert. This is a significant blow to intra-session traffic since their contribution to traffic remains virtually unnoticed. 

    Question 6. How can I account for users who have not consented to the use of third-party cookies ?

    You can’t. Google Consent Mode settings imply several options when a user rejects the use of 3rd party cookies. In GA4 and BigQuery, depersonalized cookieless pings will be sent. These pings do not contain specific client_id, session_id, or other custom dimensions. As a result, you won’t be able to consider them as users or link the actions of such users together.

    Question 7. How can I compare data in explorations with the previous year ?

    The maximum data retention period for a free GA4 account is 14 months. This means that if the date range is wider, you can only use standard reports. You won’t be able to compare or view cohorts or funnels for periods more than 14 months ago. This makes the product functionality less rich because various report formats in explorations are very convenient for comparing specific metrics in easily digestible reports.

    GA4 data retention

    Of course, you always have the option to connect BigQuery and store raw data without limitations, but this process usually requires the involvement of an advanced analyst. And precisely this option is unavailable to most marketers in small teams.

    Question 8. Is the data for yesterday accurate ?

    Unknown. Google declares that data processing in GA4 takes up to 48 hours. And although this process is faster, most users still have room for frustration. And they can be understood.

    Data processing time in GA4

    What does “data processing takes 24-48 hours” mean ? When will the data in reports be complete ? For yesterday ? Or the day before yesterday ? Or for all days that were more than two days ago ? Unclear. What should marketers tell their managers when they were asked if all the data is in this report ? Well, probably all of it… or maybe not… Let’s wait for 48 hours…

    Undoubtedly, computational resources and time are needed for data preprocessing and aggregation. It’s okay that data for today will not be up-to-date. And probably not for yesterday either. But people just want to know when they can trust their data. Are they asking for too much : just a note that this report contains all the data sent and processed by Google Analytics ?

    What should you do ?

    Credit should be given to the Google team – they have done a lot to enable users to answer these questions in one form or another. For example, you can use data streaming in BigQuery and work with raw data. The entry threshold for this functionality has been significantly lowered. In fact, if you are dissatisfied with the GA4 interface, you can organize your export to BigQuery and create your own reports without (almost) any restrictions.

    Another strong option is the widespread launch of GTM Server Side. This allows you to quite freely modify the event model and essentially enrich each hit with various parameters, doing this in a first-party context. This, of course, reduces the harmful impact of most of the limitations described in this text.

    But this is not a solution.

    The users in question – marketers, managers, developers – they do not want or do not have the time for a deep dive into the issue. And they want simple answers to simple (it seemed) questions. And for now, unfortunately, GA4 is more of a professional tool for analysts than a convenient instrument for generating insights for not very advanced users.

    Why is this such a serious issue ?

    The thing is – and this is crucial – over the past 10 years, Google has managed to create a sort of GA-bubble for marketers. Many of them have become so accustomed to Google Analytics that when faced with another issue, they don’t venture to explore alternative solutions but attempt to solve it on their own. And almost always, this turns out to be expensive and inconvenient.

    However, with the latest updates to GA4, it is becoming increasingly evident that this application is struggling to address even the most basic questions from users. And these questions are not fantastically complex. Much of what was described in this article is not an unsolvable mystery and is successfully addressed by other analytics services.

    Let’s try to answer some of the questions described from the perspective of Matomo.

    Question 1 : What are the most popular traffic sources ? [Solved]

    In the Acquisition panel, you will find at least three easily identifiable reports – for traffic channels (All Channels), sources (Websites), and campaigns (Campaigns). 

    Channel Type Table

    With these, you can quickly and easily answer the question about the most popular traffic sources, and if needed, delve into more detailed information, such as landing pages.

    Question 2 : What is my conversion rate ? [Solved]

    Under Goals in Matomo, you’ll easily find the overall conversion rate for your site. Below that you’ll have access to the conversion rate of each goal you’ve set in your Matomo instance.

    Question 3 : Can I trust user and session metrics ? [Solved]

    Yes. With Matomo, you’re guaranteed 100% accurate data. Matomo does not apply sampling, does not employ specific statistical algorithms, or any analogs of threshold values. Yes, it is possible, and it’s perfectly normal. If you see a metric in the visits or users field, it accurately represents reality by 100%.

    Try Matomo for Free

    Get the web insights you need, without compromising data accuracy.

    No credit card required

    Question 4 : How do I calculate First Click attribution ? [Solved]

    You can do this in the same section where the other 5 attribution models, available in Matomo, are calculated – in the Multi Attribution section.

    Multi Attribution feature

    You can choose a specific conversion and, in a few clicks, calculate and compare up to 3 marketing attribution models. This means you don’t have to spend several days digging through documentation trying to understand how a particular model is calculated. Have a question – get an answer.

    Question 5 : How do I account for intra-session traffic ? [Solved]

    Matomo creates a new visit when a user changes a campaign. This means that you will accurately capture all relevant traffic if it is adequately tagged. No campaigns will be lost within a visit, as they will have a new utm_campaign parameter.

    This is a crucial point because when the Referrer changes, a new visit is not created, but the key lies in something else – accounting for all available traffic becomes your responsibility and depends on how you tag it.

    Try Matomo for Free

    Get the web insights you need, without compromising data accuracy.

    No credit card required

    Question 6 : How can I account for users who have not consented to the use of third-party cookies ? [Solved]

    Google Analytics requires users to accept a cookie consent banner with “analytics_storage=granted” to track them. If users reject cookie consent banners, however, then Google Analytics can’t track these visitors at all. They simply won’t show up in your traffic reports. 

    Matomo doesn’t require cookie consent banners (apart from in the United Kingdom and Germany) and can therefore continue to track visitors even after they have rejected a cookie consent screen. This is achieved through a config_id variable (the user identifier equivalent which is updating once a day). 

    Matomo doesn't need cookie consent, so you see a complete view of your traffic

    This means that virtually all of your website traffic will be tracked regardless of whether users accept a cookie consent banner or not.

    Question 7 : How can I compare data in explorations with the previous year ? [Solved]

    There is no limitation on data retention for your aggregated reports in Matomo. The essence of Matomo experience lies in the reporting data, and consequently, retaining reports indefinitely is a viable option. So you can compare data for any timeframe. 7

    Date Comparison Selector
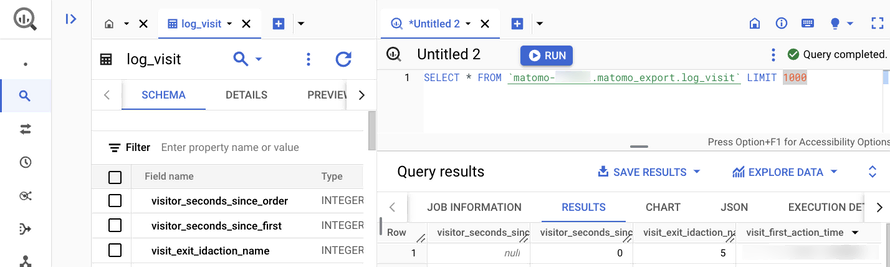
  • Introducing the Data Warehouse Connector feature

    30 janvier, par Matomo Core Team
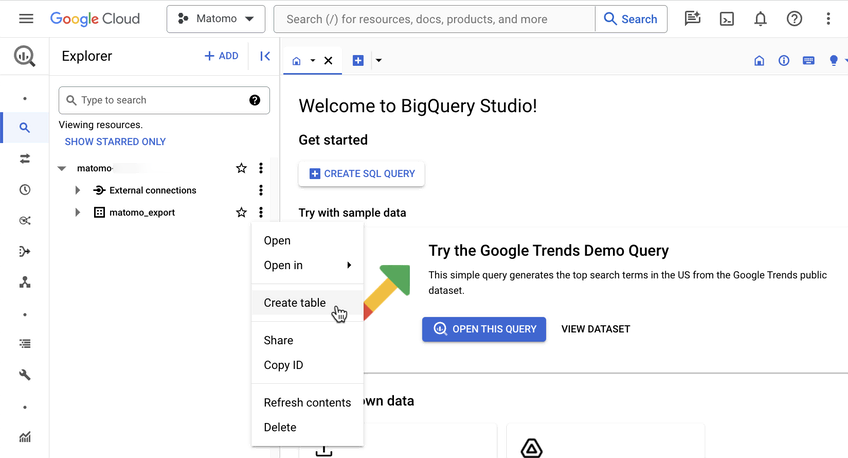
    Matomo is built on a simple truth : your data belongs to you, and you should have complete control over it. That’s why we’re excited to launch our new Data Warehouse Connector feature for Matomo Cloud, giving you even more ways to work with your analytics data. 

    Until now, getting raw data from Matomo Cloud required APIs and custom scripts, or waiting for engineering help.  

    Our new Data Warehouse Connector feature removes those barriers. You can now access your raw, unaggregated data and schedule regular exports straight to your data warehouse. 

    The feature works with all major data warehouses including (but not limited to) : 

    • Google BigQuery 
    • Amazon Redshift 
    • Snowflake 
    • Azure Synapse Analytics 
    • Apache Hive 
    • Teradata 

    You can schedule exports, combine your Matomo data with other data sources in your data warehouse, and easily query data with SQL-like queries. 

    Direct raw data access for greater data portability 

    Waiting for engineering support can delay your work. Managing API connections and writing scripts can be time-consuming. This keeps you from focusing on what you do best—analysing data. 

    BigQuery create-table-menu

    With the Data Warehouse Connector feature, you get direct access to your raw Matomo data without the technical setup. So, you can spend more time analysing data and finding insights that matter. 

    Bringing your data together 

    Answering business questions often requires data from multiple sources. A single customer interaction might span your CRM, web analytics, sales systems, and more. Piecing this data together manually is time-consuming—what starts as a seemingly simple question from stakeholders can turn into hours of work collecting and comparing data across different tools. 

    This feature lets you combine your Matomo data with data from other business systems in your data warehouse. Instead of switching between tools or manually comparing spreadsheets, you can analyse all your data in one place to better understand how customers interact with your business. 

    Easy, custom analysis with SQL-like queries 

    Standard, pre-built reports often don’t address the specific, detailed questions that analysts need to answer.  

    When you use the Data Warehouse Connector feature, you can use SQL-like queries in your data warehouse to do detailed, customised analysis. This flexibility allows you to explore your data in depth and uncover specific insights that aren’t possible with pre-built reports. 

    Here is an example of how you might use SQL-like query to compare the behaviours of paying vs. non-paying users : 

    				
                                            <xmp>SELECT  

    custom_dimension_value AS user_type, -- Assuming 'user_type' is stored in a custom dimension

    COUNT(*) AS total_visits,  

    AVG(visit_total_time) AS avg_duration,

    SUM(conversion.revenue) AS total_spent  

    FROM  

    `your_project.your_dataset.matomo_log_visit` AS visit

    LEFT JOIN  

    `your_project.your_dataset.matomo_log_conversion` AS conversion  

    ON  

    visit.idvisit = conversion.idvisit  

    GROUP BY  

    custom_dimension_value; </xmp>
                                   

    This query helps you compare metrics such as the number of visits, average session duration, and total amount spent between paying and non-paying users. It provides a full view of behavioural differences between these groups. 

    Advanced data manipulation and visualisation 

    When you need to create detailed reports or dive deep into data analysis, working within the constraints of a fixed user interface (UI) can limit your ability to draw insights. 

    Exporting your Matomo data to a data warehouse like BigQuery provides greater flexibility for in-depth manipulation and advanced visualisations, enabling you to uncover deeper insights and tailor your reports more effectively. 

    Getting started 

    To set up data warehouse exports in your Matomo : 

    1. Go to System Admin (cog icon in the top right corner) 
    2. Select ‘Export’ from the left-hand menu 
    3. Choose ‘Data Warehouse Connector’ 

    You’ll find detailed instructions in our data warehouse exports guide 

    Please note, enabling this feature will cost an additional 10% of your current subscription. You can view the exact cost by following the steps above. 

    New to Matomo ? Start your 21-day free trial now (no credit card required), or request a demo.