Recherche avancée

Médias (2)

Mot : - Tags -/map

Autres articles (91)

  • L’utiliser, en parler, le critiquer

    10 avril 2011

    La première attitude à adopter est d’en parler, soit directement avec les personnes impliquées dans son développement, soit autour de vous pour convaincre de nouvelles personnes à l’utiliser.
    Plus la communauté sera nombreuse et plus les évolutions seront rapides ...
    Une liste de discussion est disponible pour tout échange entre utilisateurs.

  • Websites made ​​with MediaSPIP

    2 mai 2011, par

    This page lists some websites based on MediaSPIP.

  • Mediabox : ouvrir les images dans l’espace maximal pour l’utilisateur

    8 février 2011, par

    La visualisation des images est restreinte par la largeur accordée par le design du site (dépendant du thème utilisé). Elles sont donc visibles sous un format réduit. Afin de profiter de l’ensemble de la place disponible sur l’écran de l’utilisateur, il est possible d’ajouter une fonctionnalité d’affichage de l’image dans une boite multimedia apparaissant au dessus du reste du contenu.
    Pour ce faire il est nécessaire d’installer le plugin "Mediabox".
    Configuration de la boite multimédia
    Dès (...)

Sur d’autres sites (10058)

  • Anomalie #2056 (Fermé) : SPIP vierge et page d’accueil de l’espace privé

    10 mai 2011, par cedric -

    doublonne #2050

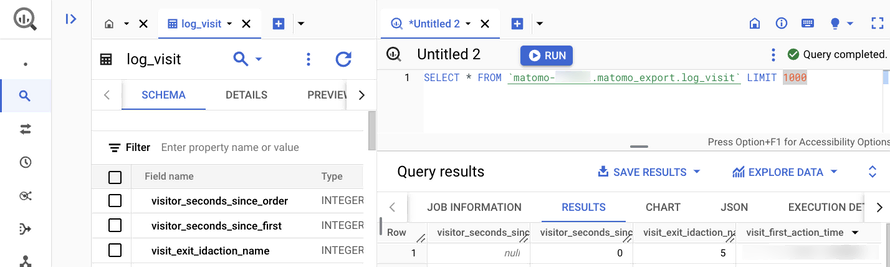
  • Introducing the Data Warehouse Connector feature

    30 janvier, par Matomo Core Team
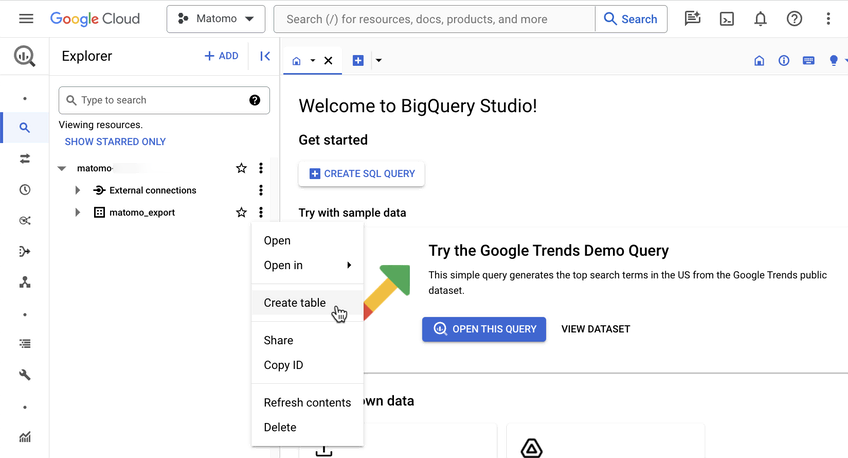
    Matomo is built on a simple truth : your data belongs to you, and you should have complete control over it. That’s why we’re excited to launch our new Data Warehouse Connector feature for Matomo Cloud, giving you even more ways to work with your analytics data. 

    Until now, getting raw data from Matomo Cloud required APIs and custom scripts, or waiting for engineering help.  

    Our new Data Warehouse Connector feature removes those barriers. You can now access your raw, unaggregated data and schedule regular exports straight to your data warehouse. 

    The feature works with all major data warehouses including (but not limited to) : 

    • Google BigQuery 
    • Amazon Redshift 
    • Snowflake 
    • Azure Synapse Analytics 
    • Apache Hive 
    • Teradata 

    You can schedule exports, combine your Matomo data with other data sources in your data warehouse, and easily query data with SQL-like queries. 

    Direct raw data access for greater data portability 

    Waiting for engineering support can delay your work. Managing API connections and writing scripts can be time-consuming. This keeps you from focusing on what you do best—analysing data. 

    BigQuery create-table-menu

    With the Data Warehouse Connector feature, you get direct access to your raw Matomo data without the technical setup. So, you can spend more time analysing data and finding insights that matter. 

    Bringing your data together 

    Answering business questions often requires data from multiple sources. A single customer interaction might span your CRM, web analytics, sales systems, and more. Piecing this data together manually is time-consuming—what starts as a seemingly simple question from stakeholders can turn into hours of work collecting and comparing data across different tools. 

    This feature lets you combine your Matomo data with data from other business systems in your data warehouse. Instead of switching between tools or manually comparing spreadsheets, you can analyse all your data in one place to better understand how customers interact with your business. 

    Easy, custom analysis with SQL-like queries 

    Standard, pre-built reports often don’t address the specific, detailed questions that analysts need to answer.  

    When you use the Data Warehouse Connector feature, you can use SQL-like queries in your data warehouse to do detailed, customised analysis. This flexibility allows you to explore your data in depth and uncover specific insights that aren’t possible with pre-built reports. 

    Here is an example of how you might use SQL-like query to compare the behaviours of paying vs. non-paying users : 

    				
                                            <xmp>SELECT  

    custom_dimension_value AS user_type, -- Assuming 'user_type' is stored in a custom dimension

    COUNT(*) AS total_visits,  

    AVG(visit_total_time) AS avg_duration,

    SUM(conversion.revenue) AS total_spent  

    FROM  

    `your_project.your_dataset.matomo_log_visit` AS visit

    LEFT JOIN  

    `your_project.your_dataset.matomo_log_conversion` AS conversion  

    ON  

    visit.idvisit = conversion.idvisit  

    GROUP BY  

    custom_dimension_value; </xmp>
                                   

    This query helps you compare metrics such as the number of visits, average session duration, and total amount spent between paying and non-paying users. It provides a full view of behavioural differences between these groups. 

    Advanced data manipulation and visualisation 

    When you need to create detailed reports or dive deep into data analysis, working within the constraints of a fixed user interface (UI) can limit your ability to draw insights. 

    Exporting your Matomo data to a data warehouse like BigQuery provides greater flexibility for in-depth manipulation and advanced visualisations, enabling you to uncover deeper insights and tailor your reports more effectively. 

    Getting started 

    To set up data warehouse exports in your Matomo : 

    1. Go to System Admin (cog icon in the top right corner) 
    2. Select ‘Export’ from the left-hand menu 
    3. Choose ‘Data Warehouse Connector’ 

    You’ll find detailed instructions in our data warehouse exports guide 

    Please note, enabling this feature will cost an additional 10% of your current subscription. You can view the exact cost by following the steps above. 

    New to Matomo ? Start your 21-day free trial now (no credit card required), or request a demo. 

  • Blog series part 2 : How to increase engagement of your website visitors, and turn them into customers

    8 septembre 2020, par Joselyn Khor — Analytics Tips, Marketing

    Long gone are the days of simply tracking page views as a measure of engagement. Now it’s about engagement analysis, which is layered and provides insight for effective data-driven decisions.

    Discover how engaged people are with your website by uncovering behavioural patterns that tell you how well your site and content is or isn’t performing. This insight helps you re-evaluate, adapt and optimise your content and strategy. The more engaged they are, the more likely you’ll be able to guide them on a predetermined journey that results in more conversions ; and helps you reach the goals you’ve set for your business. 

    Why is visitor engagement important ?

    It’s vital to measure engagement if you have anything content related that plays a role in your customer’s journey. Some websites may find more value in figuring out how engaging their entire site is, while others may only want to zone in on, say, a blogging section, e-newsletters, social media channels or sign-up pages.

    In the larger scheme of things, engagement can be seen as what’s running your site. Every aspect of the buyer’s journey requires your visitors to be engaged. Whether you’re trying to attract, convert or build a loyal audience base, you need to know your content is optimised to maintain their attention and encourage them along the path to purchase, conversion or loyalty.

    How to increase engagement with Matomo

    You need to know what’s going right or wrong to eventually be able to deliver more riveting content your visitors can’t help but be drawn to. Learn how to apply Matomo’s easy-to-use features to increase engagement :

    1. The Behaviour feature
    2. Heatmaps
    3. A/B Testing
    4. Media Analytics
    5. Transitions
    6. Custom reports
    7. Other metrics to keep an eye on

    1. Look at the Behaviour feature

    It allows you to learn how visitors are responding to your content. This information is gathered by drawing insight from features such as site search, downloads, events and content interactions. Learn more

    Matomo's behaviour feature

    Matomo’s top five ways to increase engagement with the Behaviour feature :

    Behaviour -> Pages
    Get complete insights on what pages your users engage with, what pages provide little value to your business and see the results of entry and exit pages. If important content is generating low traffic, you need to place it where it can be seen. Spend time where it matters and focus on the content that will engage with your users and see how it eventually converts them into customers.

    Behaviour -> Site search
    Site search tracks how people use your website’s internal search engine. You can see :

    • What search keywords visitors used on your website’s internal search.
    • Which of those keywords resulted in no results (what content your visitors are looking for but cannot find).
    • What pages visitors visited immediately after a search.
    • What search categories visitors use (if your website employs search categories).

    Behaviour -> Downloads
    What are users wanting to take away with them ? They could be downloading .pdfs, .zip files, ebooks, infographics or other free/paid resources. For example, if you were working for an education institution and created valuable information packs for students that you made available online in .pdf format. To see an increase in downloads meant students were finding the .pdfs and realising the need to download them. No downloads could mean the information packs weren’t being found which would be problematic.

    Behaviour -> Events
    Tracking events is a very useful way to measure the interactions your users have with your website content, which are not directly page views or downloads.

    How have Events been used effectively ? A great example comes from one of our customers, Catalyst. They wanted to capture and measure the user interaction of accordions (an area of content that expands or closes depending on how a user interacts with it) to see if people were actually getting all the information available to them on this one page. By creating an Event to record which accordion had been opened, as well as creating events for other user interactions, they were able to figure out which content got the most engagement and which got the least. Being able to see how visitors navigated through their website helped them optimise the site to ensure people were getting the relevant information they were craving.

    Behaviour -> Content interactions
    Content tracking allows you to track interaction within the content of your web page. Go beyond page views, bounce rates and average time spent on page with your content. Instead, you can analyse content interaction rates based on mouse clicking and configuring scrolling or hovering behaviours to see precisely how engaged your users are. If interaction rates are low, perhaps you need to restructure your page layout to grab your user’s attention sooner. Possibly you will get more interaction when you have more images or banner ads to other areas of your business.

    Watch this video to learn about the Behaviour feature

    2. Set up Heatmaps

    Effortlessly discover how your visitors truly engage with your most important web pages that impact the success of your business. Heatmaps shows you visually where your visitors try to click, move the mouse and how far down they scroll on each page.

    Matomo's heatmaps feature

    You don’t need to waste time digging for key metrics or worry about putting together tables of data to understand how your visitors are interacting with your website. Heatmaps make it easy and fast to discover where your users are paying their attention, where they have problems, where useless content is and how engaging your content is. Get insights that you cannot get from traditional reports. Learn more

    3. Carry out A/B testing

    With A/B Testing you reduce risk in your decision-making and can test what your visitors are responding well to. 

    Matomo's a/b testing feature

    Ever had discussions with colleagues about where to place content on a landing page ? Or discussed what the call-to-action should be and assumed you were making the best decisions ? The truth is, you never know what really works the best (and what doesn’t) unless you test it. Learn more

    How to increase engagement with A/B Testing : Test, test and test. This is a surefire way to learn what content is leading your visitors on a path to conversion and what isn’t.

    4. Media Analytics

    Tells you how visitors are engaging with your video or audio content, and whether they’re leading to your desired conversions. Track :

    • How many plays your media gets and which parts they viewed
    • Finish rates
    • How your media was consumed over time
    • How media was consumed on specific days
    • Which locations your users were viewing your content from
    • Learn more
    Media Analytics

    How to increase engagement with Media Analytics : These metrics give a picture of how audiences are behaving when it comes to your content. By showing insights such as, how popular your media content is, how engaging it is and which days content will be most viewed, you can tailor content strategies to produce content people will actually find interesting and watch/listen.

    Matomo example : When we went through the feature video metrics on our own site to see how our videos were performing, we noticed our Acquisition video had a 95% completion rate. Even though it was longer than most videos, the stats showed us it had, by far, the most engagement. By using Media Analytics to get insights on the best and worst performing videos, we gathered useful info to help us better allocate resources effectively so that in the future, we’re producing more videos that will be watched.

    5. Investigate transitions

    See which page visitors are entering the site from and where they exit to. Transitions shows engagement on each page and whether the content is leading them to the pages you want them to be directed to.

    Transitions

    This gives you a greater understanding of user pathways. You may be assuming visitors are finding your content from one particular pathway, but figure out users are actually coming through other channels you never thought of. Through Transitions, you may discover and capitalise on new opportunities from external sites.

    How to increase engagement with Transitions : Identify clearly where users may be getting distracted to click away and where other pages are creating opportunity to click-through to conversion. 

    6. Create Custom Reports

    You can choose from over 200 dimensions and metrics to get the insights you need as well as various visualisation options. This makes understanding the data incredibly easy and you can get the insights you need instantly for faster results without the need for a developer. Learn more

    Custom Reports

    How to increase engagement with Custom Reports : Set custom reports to see when content is being viewed and figure out how engaged users are by looking at different hours of the day or which days of the week they’re visiting your website. For example, you could be wondering what hour of the day performed best for converting your customers. Understanding these metrics helps you figure out the best time to schedule your blog posts, pay-per-click advertising, edms or social media posts knowing that your visitors are more likely to convert at different times.

    7. Other metrics to key an eye on …

    A good indication of a great experience and of engagement is whether your readers, viewers or listeners want to do it again and again.

    “Best” metrics are hard to determine so you’ll need to ask yourself what you want to do or what you want your site to do. How do you want your users to behave or what kind of buyer’s journey do you want them to have ?

    Want to know where to start ? Look at …

    • Bounce rate – a high bounce rate isn’t great as people aren’t finding what they’re looking for and are leaving without taking action. (This offers great opportunities as you can test to see why people are bouncing off your site and figure out what you need to change.)
    • Time on site – a long time on site is usually a good indication that people are spending time reading, navigating and being engaged with your website. 
    • Frequency of visit – how often do people come back to interact with the content on your website ? The higher the % of your visitors that come back time and time again will show how engaged they are with your content.
    • Session length/average session duration – how much time users spend on site each session
    • Pages per session – is great to show engagement because it shows visitors are happy going through your website and learn more about your business.

    Key takeaway

    Whichever stage of the buyer’s journey your visitors are in, you need to ensure your content is optimised for engagement so that visitors can easily spend time on your website.

    “Every single visit by every single visitor is no longer judged as a success or a failure at the end of 29 min (max) session in your analytics tool. Every visit is not a ‘last-visit’, rather it becomes a continuous experience leading to a win-win outcome.” – Avinash Kaushik

    As you can tell, one size does not fit all when it comes to analysing and measuring engagement, but with a toolkit of features, you can make sure you have everything you need to experiment and figure out the metrics that matter to the success of your business and website.

    Concurrently, these gentle nudges for visitors to consume more and more content encourages them along their path to purchase, conversion or loyalty. They get a more engaging website experience over time and you get happy visitors/customers who end up coming back for more.

    Want to learn how to increase conversions with Matomo ? Look out for the final in this series : part 3 ! We’ll go through how you can boost conversions and meet your business goals with web analytics.